
Centralized Reporting for Auto Repair Shops: A Practical
Monday morning starts with a familiar question: which location had the strongest week? The owner of a four-location repair group opens QuickBooks, the shop management system, a parts supplier portal, and a technician's handwritten board. Five spreadsheets later, last week's revenue, average repair order, and comeback rate still don't agree before the 9 a.m. bank call.
By the time the figures match, they're already stale. One shop counted internal fleet work in its average repair order, another classified labor differently, and a third hadn't entered several closed jobs. The problem isn't a lack of effort. It's fragmented reporting.
Centralized reporting gives owners and managers one operational view built on comparable definitions. Historical administrative practice shows why this approach persists. U.S. federal statistical reporting functions were repeatedly consolidated and redistributed, including the creation of a formal Statistical Reporting Service, as agencies tried to manage fragmented information through common reporting structures. The provides useful context for seeing centralization as a management response, not merely a software trend.
For auto repair shops, the practical payoff is straightforward: faster location comparisons, consistent KPI definitions, and one source of truth that advisors, technicians, managers, and owners can read the same way.
Table of Contents
- The Spreadsheet Trap and What Centralized Reporting Fixes
- What Centralized Reporting Actually Means for a Shop
- The Four KPI Families Every Shop Should Track
- Data Sources and Architecture Behind One Dashboard
- Implementation Checklist for Integration, Governance, and Access
- Sample Report Templates and an ROI Snapshot
- Common Pitfalls and Troubleshooting Moves
- Bringing It All Together and What to Do Next
The Spreadsheet Trap and What Centralized Reporting Fixes
The spreadsheet trap begins when each system appears useful on its own. QuickBooks handles accounting, the shop management platform stores repair orders, the parts portal shows purchases, payroll tracks hours, and a handwritten board reflects what's happening in the bays. None of those tools necessarily gives the owner a dependable answer about the whole business.
A manager might export closed invoices on Friday, copy parts costs into a workbook, and ask each location to fill in missing labor hours. Another manager may use a different definition of a closed repair order or exclude declined work from the close-ratio calculation. The final report looks organized, but the underlying comparisons aren't fair.
Practical rule: If two locations calculate a KPI differently, the business doesn't have two performance results. It has two incompatible definitions.
Centralized reporting fixes the process by bringing operational feeds into one reporting model. The system still needs accurate source data, but the team no longer has to rebuild the same report manually every week. Revenue, labor, parts, vehicle status, estimates, and customer activity can be presented through one dashboard with shared filters and documented calculations.
That distinction matters. A dashboard that displays disconnected feeds is still a collection of gauges. A centralized reporting system standardizes the fields behind those gauges, identifies which system owns each value, and lets managers drill from a summary into the repair orders that produced it.
The value of this approach extends beyond automotive operations. A illustrates the broader operational shift from spreadsheet-based reporting to a live dashboard. The lesson applies to repair groups as well: leadership meetings should focus on decisions, not on arguing over which worksheet is correct.
The practical wins are visible in the Monday meeting:
- Location comparisons: Owners can compare revenue, technician output, and customer activity without requesting separate exports.
- Consistent KPI definitions: ARO and labor efficiency mean the same thing at every shop.
- Faster exception handling: Managers can investigate a weak result while the underlying repair orders are still accessible.
- Shared accountability: Advisors and technicians see the operational measures relevant to their roles instead of relying on hearsay.
What Centralized Reporting Actually Means for a Shop
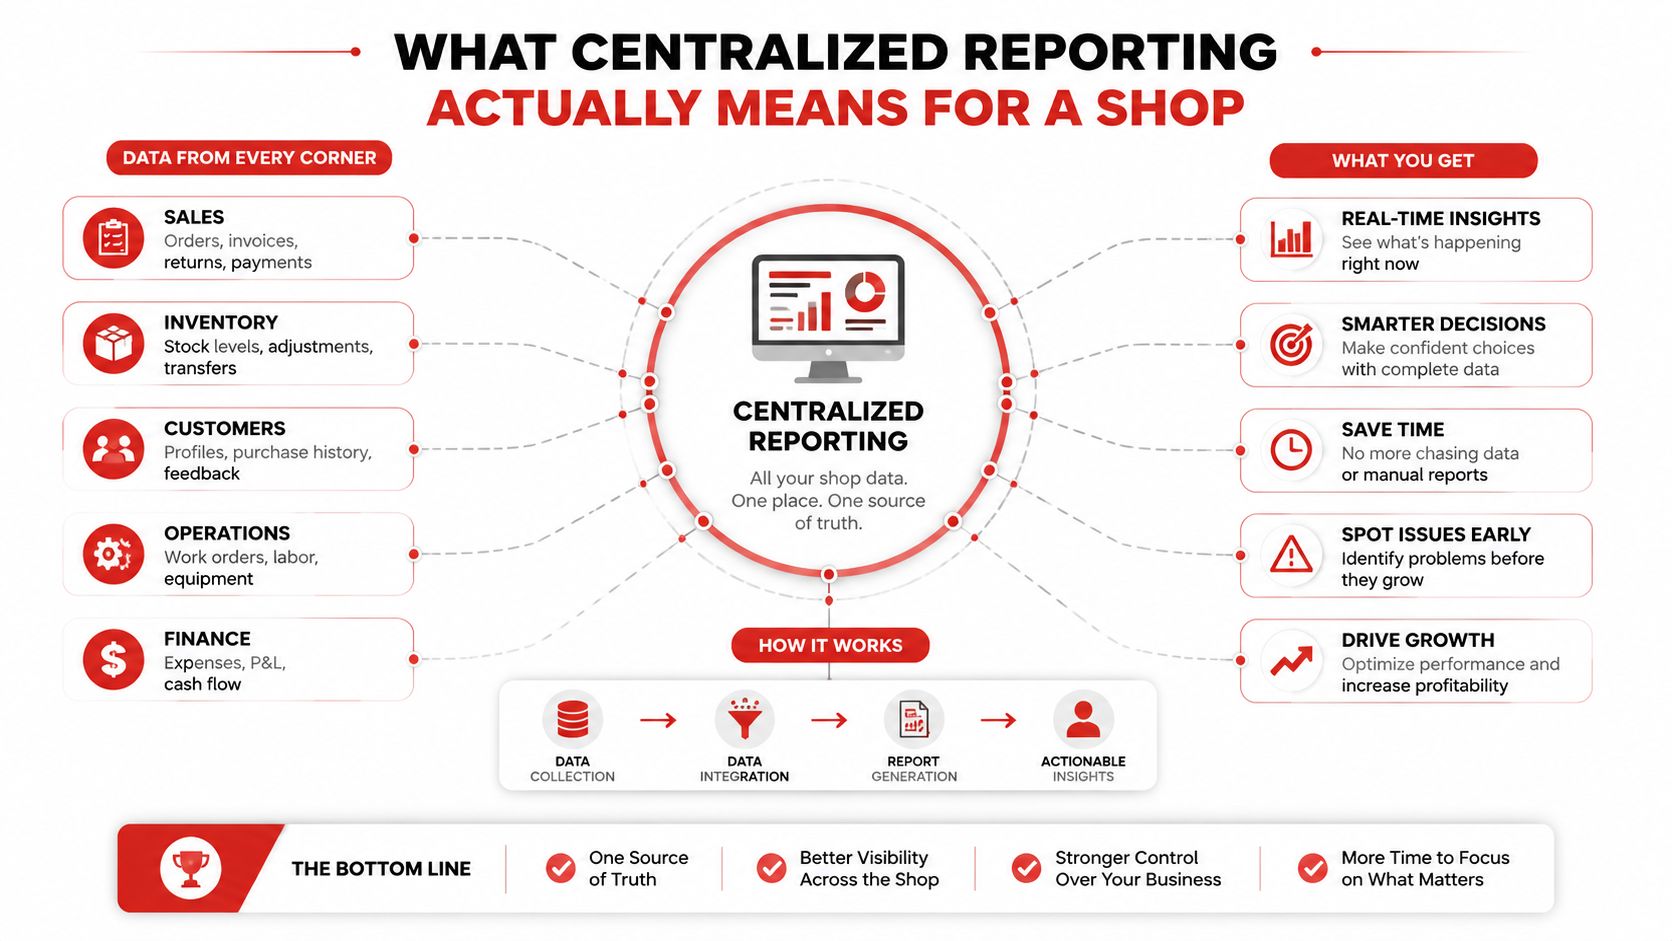
Centralized reporting is the shop's instrument cluster. It isn't a stack of gauges scattered across the bays, the front desk, accounting office, and owner's laptop. The instrument cluster only helps when every reading comes from a dependable source and uses the same scale.
A practical setup has four components.
A unified data layer
The reporting system connects shop management software, dealer management systems, parts inventory, payroll, time clocks, and customer relationship tools. Repair orders, invoices, labor, parts, and customer records need a common structure so the dashboard can relate them to one another.
Standardized definitions
Revenue, labor hours, parts costs, average repair order, technician efficiency, and repeat business must be calculated identically across locations and shifts. Standardization doesn't erase local differences. It makes those differences visible without allowing inconsistent data entry to disguise them.
Role-based dashboards
Owners need a consolidated financial and operational view. Location managers need throughput, open work, labor, and follow-up activity. Technicians need their own hours and efficiency, not confidential payroll or company-level financial information. Advisors need open estimates, declined work, customer history, and follow-up queues.
Scheduled and on-demand reporting
A centralized system should push recurring reports automatically while allowing managers to drill into a location, technician, vehicle, or repair order when a number changes. Scheduled reporting supports regular reviews. On-demand reporting supports the questions that arise during the day.
The most important design decision comes before the dashboard layout. Each business must decide which system owns each data point, how fields map across locations, and who can change a definition. A polished interface won't correct duplicate customer records or mismatched labor categories.
That's why centralized reporting is primarily a standardization problem, and only afterward a dashboard problem. Multi-location reporting guidance from reinforces the operational point: comparable accounting and KPI definitions make cross-location benchmarking valid, while consolidated reporting reduces manual reconciliation and communication gaps.
The Four KPI Families Every Shop Should Track
A multi-location shop can fill a dashboard with measurements and still miss the numbers that explain whether work is profitable, flowing efficiently, and bringing customers back. The practical answer is a shared operating scoreboard built around four KPI families, with the same definitions and workflow at every site.
The first family is revenue and profitability. Track gross profit per repair order, gross margin by service category, and revenue per bay day. Revenue by itself can make a location look healthy while low-margin work, heavy discounting, or excessive parts cost erodes the result. In RedAppy's analytics view, a manager should be able to move from a weak margin category to the repair orders behind it, then compare the same category across locations.
The second family is average repair order, or ARO:
ARO = total labor and parts revenue ÷ closed invoices
The formula is only comparable when every location handles closed invoices, internal work, discounts, and warranty work in the same way. ARO links inspection quality, advisor communication, approved work, and vehicle history to one commercial outcome. It should guide process review, not encourage advisors to add unnecessary work.
The third family is technician efficiency. Start with billed hours compared with flagged hours, then review jobs completed per technician, touch time, and cycle time. Those measures separate genuine output from a full schedule that produces little completed work. The describes dashboard views for employee activity, active jobs, completed-job timing, and vehicle status. These views help a manager investigate the cause of a result instead of watching the number change.
The fourth family is customer retention. Repeat visits, declined-work follow-up, inspection history, and comeback activity belong in one workflow because loyalty depends on service quality and communication. Retention reporting should identify which customers returned, which recommendations remain open, and whether a comeback points to repair quality, a parts issue, or an unrelated concern.
| KPI Family | Key Formula | Healthy Benchmark | What Centralization Reveals |
|---|---|---|---|
| Revenue and profitability | Gross profit per repair order, margin by category, revenue per bay day | Productive shops may operate around $1,000 to $1,400 per bay day | Which locations and service categories produce profitable work |
| Average repair order | Labor and parts revenue ÷ closed invoices | Market and vehicle mix can support approximately $450 to $650 | Whether inspection, follow-up, and approval processes differ by site |
| Technician efficiency | Billed hours ÷ flagged hours | A commonly used target range is 85% to 100% | Where clocking, scheduling, dispatch, or training affects output |
| Customer retention | Repeat visits within the selected retention window | A working target can be 55% to 70%, with comeback rate under 3% | Whether service quality and follow-up produce repeat business across sites |
Centralizing these families turns separate spreadsheets into one comparable scoreboard. It also exposes relationships that isolated reports hide. A location with strong ARO but weak repeat visits may be selling effectively while disappointing customers. Another with high technician hours but weak revenue may have parts delays, pricing problems, or inaccurate time capture. The review workflow should follow the same sequence each time: confirm the KPI definition, compare locations, drill into the underlying repair orders, and assign an operational response.
Data Sources and Architecture Behind One Dashboard
A reliable reporting view rests on a layered data architecture. The layers can be supplied by one vendor or connected across several systems, but each layer needs a defined purpose and a dependable matching key.
Layer one, operational systems
This layer contains repair orders, estimates, invoices, scheduling, parts inventory, dispatch, and payroll or time-clock records. The shop management platform usually owns the work order lifecycle. Parts systems add purchase and usage information, while time systems explain how labor moved through the job.
Layer two, customer and vehicle records
CRM records, vehicle histories, inspection forms, digital inspection photos, contact details, and declined-work notes belong here. These records connect the current visit to the customer's previous decisions and the vehicle's service history.
Layer three, financial systems
Accounting exports from QuickBooks or Xero, merchant-service records, and bank feeds support reconciliation. These sources help separate operational performance from cash movement and accounting treatment. A dashboard should show which figures come from posted accounting records and which come from operational transactions.
Layer four, analytics
The reporting layer receives the streams, matches them, applies governance rules, and presents the results. It may be a warehouse, central database, or vendor-managed analytics model. The technology matters less than the data relationships.
Matching logic is where many dashboards fail. Repair order numbers connect invoices, labor, parts, and payment activity. Customer IDs connect visits and follow-up. Vehicle identification numbers connect service history, inspections, and future work. If one location uses a different identifier format, the dashboard may split one customer into multiple records or attach parts to the wrong job.
Teams evaluating integration patterns can use the as a broader reference point. The same principle applies in a garage: map fields before building attractive charts.
A shop generally faces two architectural choices. A single-vendor stack, such as RedAppy, keeps operational, customer, and analytics layers native to one environment. An integrated stack stitches separate systems together with middleware, which can offer flexibility but requires more ownership of mappings, monitoring, and data-quality rules.
Implementation Checklist for Integration, Governance, and Access
A shop manager should be able to hand the following checklist to an administrator and review progress without relying on vague promises.
Inventory every system. List every application, portal, spreadsheet, time clock, and payment source that touches a repair order, estimate, customer, vehicle, parts transaction, or employee hour. Include handwritten processes because they often reveal missing fields.
Choose the source of truth. Designate the master system for each data type. The shop management system may own repair order status, accounting may own posted revenue, and payroll may own paid labor. Document exceptions instead of letting staff decide case by case.
Freeze spreadsheet edits. Keep historical workbooks available for reference, but stop using them as parallel production systems. Manual edits create a second version of the truth and make later reconciliation difficult.
Connect the operational feed. Use a native API where available. If an API isn't available, use a scheduled CSV process with a named owner and a documented import routine. Verify that repair order counts and totals reconcile to the prior week before trusting trend charts.
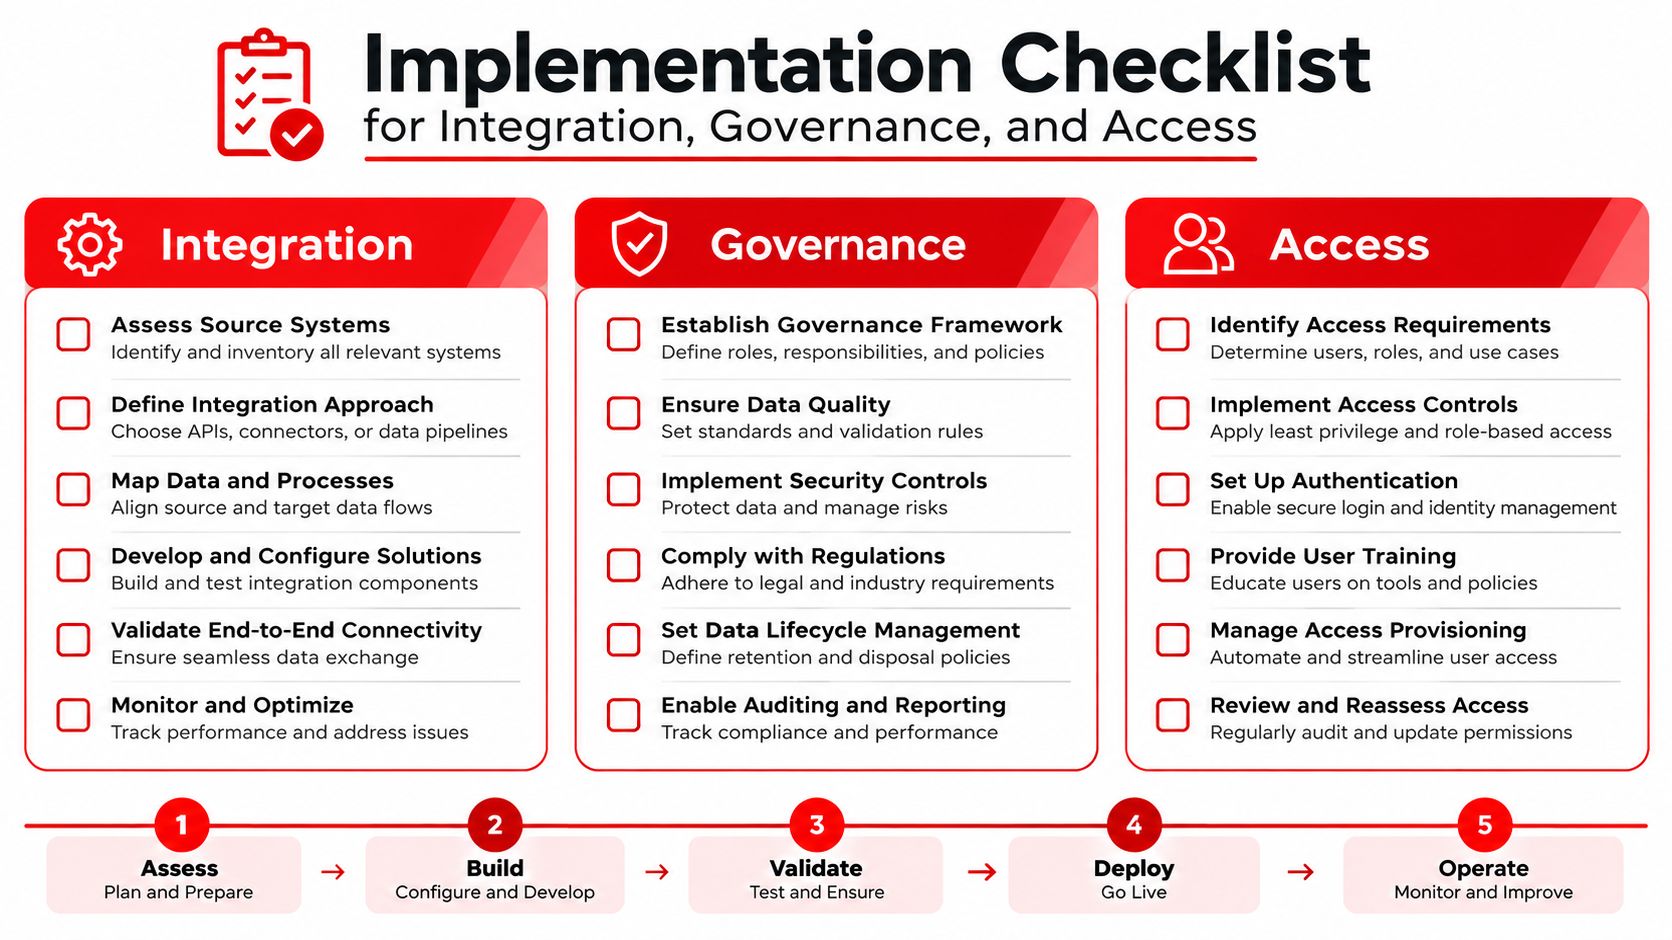
Map fields and categories. Standardize labor, parts, service categories, payment types, discounts, warranty work, and internal work across locations. ARO must mean the same thing in every branch, whether the shop operates in Tampa, Tucson, or another market.
Write governance rules. Define who can edit source data, who approves a KPI definition, how disputes are resolved, and when a change takes effect. A metric should never change without transparency because one manager adjusted a spreadsheet formula.
Configure role-based access. Owners need full P&L visibility. Managers need shop-level KPIs and labor details. Technicians should see their own efficiency and hours. Advisors need open repair orders, declined-work queues, and customer follow-up lists. Access should match responsibility.
Test, train, and review. Run sample historical data through the model, compare results with known records, and have staff test the screens they'll use daily. Training should cover how to interpret a KPI and how to report a suspected data error, not just where to click.
Governance habit: Hold a short weekly data review, then use a monthly KPI recalibration meeting for definition changes. Frequent small corrections are safer than a major rebuild after trust has disappeared.
The implementation succeeds when managers use the dashboard during regular operating decisions. If the report is only opened for an ownership meeting, the shop has created a presentation tool, not a management system.
Sample Report Templates and an ROI Snapshot
A finished reporting system should make the weekly meeting shorter and more specific. The first view can be a weekly shop snapshot, while a second view ranks locations and flags meaningful variance.
| Metric | This Week | 4-Week Avg | Target | Flag |
|---|---|---|---|---|
| Total revenue | Current result | Rolling average | Approved plan | Compare |
| Car count | Current result | Rolling average | Capacity plan | Compare |
| Average repair order | Current result | Rolling average | Location target | Review |
| Estimate close ratio | Current result | Rolling average | Agreed benchmark | Follow up |
| Technician hours billed versus available | Current result | Rolling average | Shop target | Investigate |
| Parts-to-labor ratio | Current result | Rolling average | Category target | Review |
The weekly view should answer what changed and where a manager needs to act. It shouldn't reward a location for filling the screen with minor activity measures that don't connect to revenue, throughput, quality, or retention.
A monthly multi-location rollup should rank each branch by revenue, ARO, technician utilization, repeat customer rate, and warranty claim rate. Variance flags should lead managers to the underlying work. For example, a lower ARO might reflect weaker inspection approvals, a different vehicle mix, or internal work included in the calculation.
A published centralized reporting case study offers quantified evidence that standardization can extend beyond convenience. The global-company example reported a 15% increase in top-line growth, a 25% improvement in operational efficiency, and a 60% increase in data-driven decision-making after fragmented Jira reporting was moved into a unified analytics and reporting platform. Those results belong to that specific case and shouldn't be treated as a promise for every repair shop, but they show why leadership teams measure reporting as an operating capability.
A shop can also build its own ROI model without claiming a guaranteed outcome. Connect each business improvement to a report view:
- Follow-up visibility: The estimate and declined-work view shows which approvals need advisor attention.
- ARO movement: The revenue view separates labor, parts, discounts, and internal work.
- Technician efficiency: The labor view compares billed hours, flagged hours, touch time, and cycle time.
- Location performance: The rollup identifies which branch needs coaching, staffing changes, or process review.
The strongest ROI case usually comes from several small decisions made faster, not from one dramatic dashboard number.
Common Pitfalls and Troubleshooting Moves
The most common implementation failure happens before the first chart is built. A shop wants the dashboard immediately, skips source-system mapping, and then discovers phantom revenue, missing labor, or duplicated parts within the first reporting cycle.
One frequent break occurs when point-of-sale parts data and shop-management records use different transaction identifiers. Another occurs when a location includes internal fleet work in ARO while other locations exclude it. Technician efficiency becomes unreliable when clock-in activity lags behind repair order status.
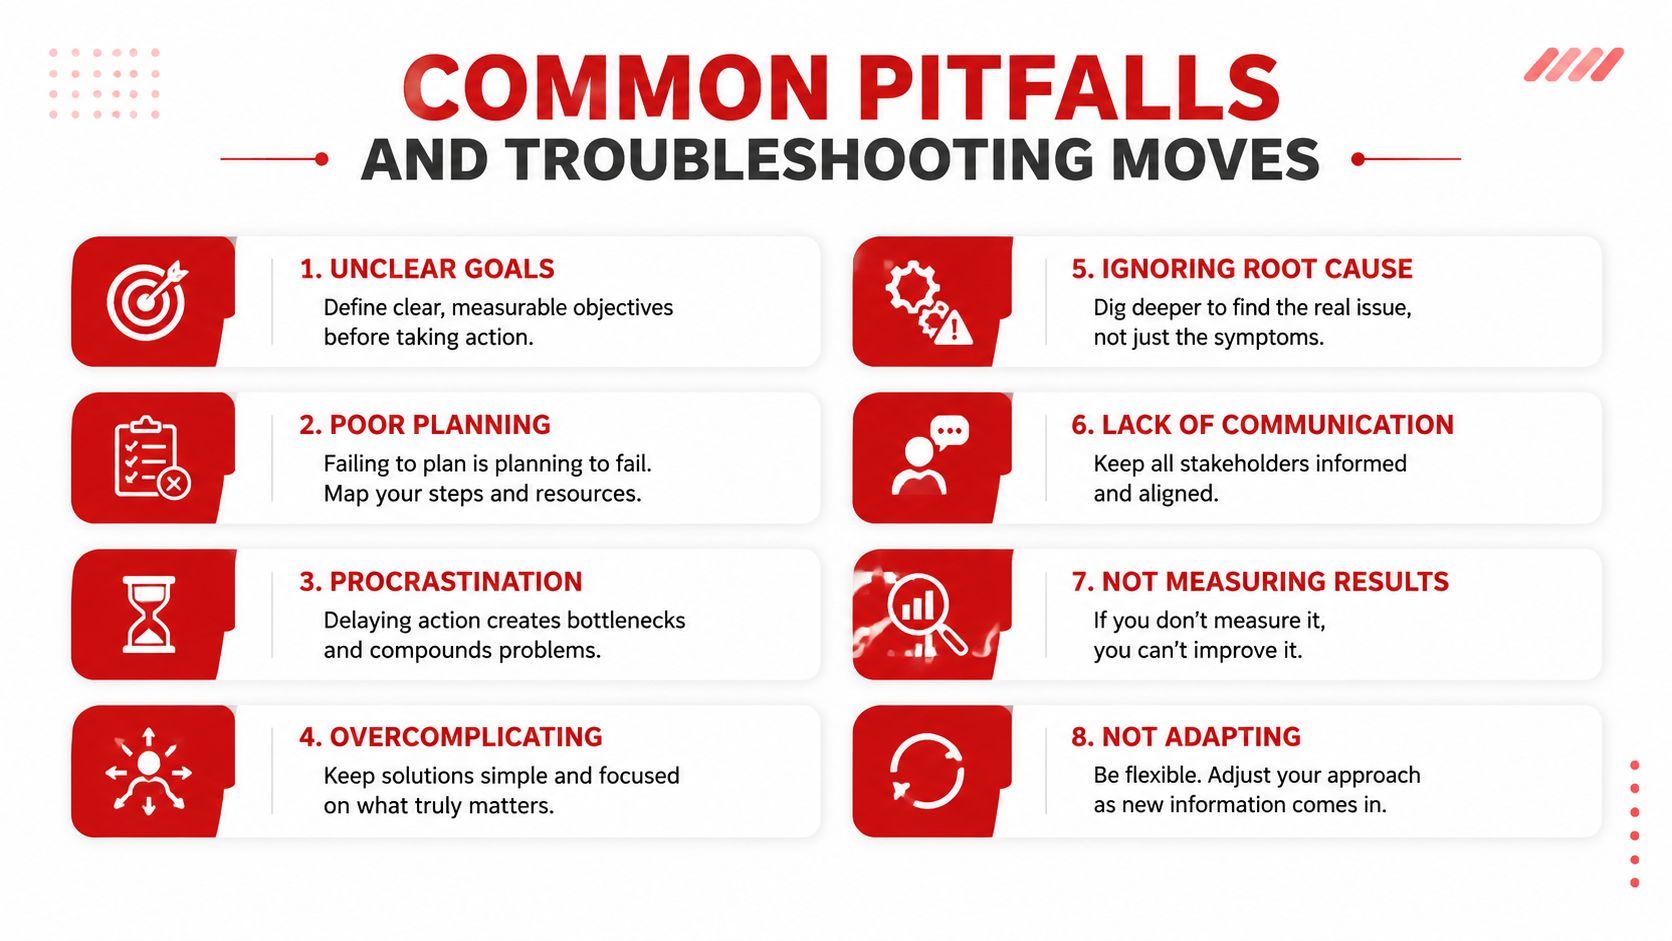
The troubleshooting response should be operational, not cosmetic:
- Freeze source identifiers: Don't rename repair order, customer, or vehicle IDs casually once the reporting model uses them.
- Reconcile weekly: Compare repair orders closed with parts invoiced and investigate mismatches before they reach a management report.
- Isolate recurring breakpoints: Track the four to six line items that cause the most errors, such as discounts, warranty work, internal labor, parts credits, and canceled invoices.
- Require dual approval: Have two roles sign off on any KPI definition change, usually an operations owner and a finance or administrative owner.
- Log exceptions: Record why a transaction was excluded, remapped, or corrected so the same dispute doesn't return during the next meeting.
Data governance programs commonly bring completeness, accuracy, consistency, timeliness, uniqueness, and validity into one reporting layer. The connects those measures to lineage, audit work, root-cause tracing, and financial risk.
Centralized reporting is therefore an ongoing data-quality discipline, not a one-time installation. The dashboard remains trusted when the team checks the source records, documents changes, and treats a strange number as a signal to investigate rather than an inconvenience to hide.
Bringing It All Together and What to Do Next
Centralized reporting works as a connected workflow. Operational systems supply repair orders, labor, parts, and scheduling. Customer and vehicle records add history and follow-up context. Financial systems support reconciliation. Governance rules turn those inputs into four usable KPI families: revenue and profitability, ARO, technician efficiency, and customer retention.
The next step is practical. Map every current data source, identify the owner of each field, and score each location on the four KPI families using the definitions already in place. Then compare those definitions with the weekly snapshot and multi-location rollup described above.
A walkthrough of a multi-location analytics view can show whether the reporting model supports real decisions, including technician coaching, declined-work follow-up, parts investigation, and branch comparison. Growing shops should install this standardization layer before opening the next location, not after inconsistent processes have spread across the group.
RedAppy brings shop workflow, customer and vehicle records, parts activity, digital inspections, invoicing, and analytics into one operating environment for independent and multi-location repair businesses. Visit RedAppy to review the analytics features or contact the team for a practical walkthrough of how centralized reporting can fit the shop's current process.
Ready to Transform Your Shop?
RedAppy helps auto repair shops create professional digital estimates with photos and videos, send them instantly via text or email, and get customer approvals in seconds. No credit card required to start.