
How to Calculate Labor Productivity in Your Auto Shop
Your bay looks full, the phones are ringing, and everyone seems busy. Then Friday lands, the numbers come in, and the week feels thinner than it should have been. That's the moment labor productivity stops being a theory and starts being the number that tells a shop owner whether work is turning into profit.
For an auto shop, how to calculate labor productivity is really about tying time to output in a way that supports decisions. It helps answer practical questions, like whether a tech is carrying the right load, whether a job was priced with enough labor, and whether the schedule is set up for throughput or for wasted motion. The useful part is not just the ratio itself, but the story it tells when it's tracked the same way every week.
Table of Contents
- Why Productivity Numbers Matter in a Repair Shop
- The Six Terms You Need Before Any Calculation
- The Three Formulas With Worked Examples
- Reading the Numbers Without Misleading Yourself
- Five Calculation Mistakes That Skew Every Number
- Setting a Weekly Rhythm That Sticks
Why Productivity Numbers Matter in a Repair Shop
A shop owner can have a packed lot and still have a weak week. That's because busy is not the same as productive, and revenue alone doesn't explain where the time went. Labor productivity gives the owner a cleaner scoreboard, one that shows whether output is rising faster than labor input, which is the practical reason statistical agencies use output per hour worked as a preferred measure.
The decision it changes on Monday morning
A strong productivity number changes the conversation from “the shop felt slammed” to “which jobs, which techs, and which delays moved the week?” That matters when pricing jobs, because a labor estimate that looked fine on paper can still fail if the hours behind it were misread. It matters when deciding whether to hire, because a second tech only helps if the work mix and hours support the added capacity. It matters when a technician's numbers drift, because the owner can separate a real performance issue from a scheduling or job-mix problem.
Practical rule: if the number can't help decide pricing, staffing, or workflow, it's probably just noise.
Revenue also hides the structure of the work. A shop can collect good money from a few large jobs and still underperform on labor use, while another shop can move many smaller jobs efficiently and still look modest on the top line. Labor productivity is the sharper lens because it focuses on the relationship between output and labor input, not just cash collected.
What the ratio reveals that revenue does not
The Bureau of Labor Statistics defines labor productivity as real output divided by hours worked, and also notes that labor input can be measured by workers employed or hours worked depending on the data available. That distinction matters in a shop because overtime, part-time coverage, and absenteeism can all change the labor picture even when headcount stays flat. The same job volume can look very different once hours are the denominator.
A shop that tracks this weekly can spot a slow drift before it turns into a bad month.
That's the value. Productivity numbers help the owner stop guessing which part of the operation needs attention and start seeing where labor is leaking out of the week.
The Six Terms You Need Before Any Calculation
The brake-job example below keeps the vocabulary grounded. A tech gets one brake service, one diagnostic check, and a couple of follow-up tasks during the week, and the shop needs to know which hours count, which hours don't, and which number should land in the report. The definitions matter because a manager and a technician often use the same words to mean different things.

Start with the hours that actually count
Available hours are the hours a tech was scheduled or on the clock and available to work. In the brake-job example, that includes the shift time the tech was present for the day. Productive hours are the hours spent on direct, output-producing work, like replacing pads, resurfacing rotors, or completing the diagnostic tied to the job.
Billed hours are the labor hours the shop charges the customer for. They may match productive hours on a clean job, but they often don't match exactly when a job runs long, gets interrupted, or includes non-billable time. That difference is why time clock data alone doesn't tell the whole story.
Use these three terms with care
Utilization is the share of available time that became productive time. If a tech was on shift but spent part of the day on waiting, cleanup, or setup, utilization helps show how much of the day turned into direct work. Efficiency compares billed hours to productive hours, so it shows whether the tech completed work at the expected pace.
Revenue per labor hour ties the labor time to money collected. It answers a different question from efficiency, because one looks at labor output in hours and the other looks at dollars. The two can move in different directions if the job mix changes.
Keep the reporting fields aligned
The sixth term is the one owners sometimes skip because it sits in a different software column. Source field means the place where the number lives, such as the time clock, the repair order, or the invoice record. A brake job might live across all three, but the owner still needs one clean source for each metric so the report isn't stitched together from mismatched inputs.
A useful outside reference for compensation definitions is, because shops that compare labor cost and pay structure often need to separate wage, benefit, and labor-hour logic before the numbers make sense.
| Field | What It Captures | Source |
|---|---|---|
| Available hours | Time the tech was scheduled or present | Time clock |
| Productive hours | Direct job time | Labor tracking |
| Billed hours | Hours charged to the customer | Repair order |
| Utilization | Productive hours compared with available hours | Calculated from time data |
| Efficiency | Billed hours compared with productive hours | Calculated from job and time data |
| Revenue per labor hour | Money earned for each labor hour | Invoice plus labor hours |
The Three Formulas With Worked Examples
At the shop counter, the formulas are the easy part. The hard part is keeping the inputs clean enough that the numbers mean the same thing every week, because once one report mixes hours from one source and labor dollars from another, the result stops helping with pricing, scheduling, and approvals. The Bureau of Labor Statistics notes that if productivity is calculated from indexes, the output and hours series must share the same base period, and the percent change in a ratio is approximately the percent change in output minus the percent change in hours.
The technician-level example
Start with one tech in one week. The tech is scheduled for 40 hours. Of those, 30 hours are productive direct work, and the tech completes 24 billed hours worth of labor on the repair orders.
- Utilization = productive hours ÷ available hours
- Efficiency = billed hours ÷ productive hours
- Revenue per labor hour = labor revenue ÷ labor hours worked
Using the example above, utilization is 30 ÷ 40, efficiency is 24 ÷ 30, and revenue per labor hour depends on the shop's labor rate and collected labor revenue. If the shop charges by labor hour, the owner can substitute the actual labor dollars from the invoices and divide by the hours worked to see how much money the labor time produced.
The three ratios answer three different management questions. Utilization shows whether the schedule used the day well. Efficiency shows whether the tech turned hands-on time into billed time well. Revenue per labor hour shows whether that work mix paid the shop enough to justify the slot in the schedule.
Manager's shortcut: utilization points to scheduling, efficiency points to execution, and revenue per labor hour points to job mix and pricing.
The shop-level example
Now take three techs. Tech A works the week cleanly, Tech B gets buried in interruptions, and Tech C has strong pace but too much waiting between jobs. The shop's blended number is the combined result of all three, not a simple average of their personalities.
That difference matters because one strong tech can hide weak workflow in the rest of the operation. The shop total shows whether the business is converting labor into output as a system, while the technician total shows where the drag sits. The International Labour Organization defines labor productivity as output per unit of labor input, either per employed person or per hour worked, which is why the same logic scales from one tech to the whole shop.
A useful cross-check is this. If the shop's labor hours go up but the output does not keep pace, productivity falls. If output climbs while labor hours stay steady, productivity rises. That is the practical use of the ratio, and it is why weekly trend watching matters more than staring at one isolated report. For a broader context on how weak productivity shows up across businesses, you can.
Reading the Numbers Without Misleading Yourself
A single ratio can make a weak operation look healthy, or a healthy operation look weak, if the owner reads it without context. A technician can post strong utilization and still create comebacks, while another tech can have solid efficiency and still slow the schedule because work sits too long between stages. The OECD manual separates value-added-based labor productivity from gross-output-based labor productivity for exactly this reason, because the output definition changes the story.
Technician level versus shop level
At the technician level, utilization shows whether the day was used well. At the shop level, utilization shows whether the whole operation had enough direct work in the pipe. At the technician level, efficiency shows whether one person kept pace with the expected labor time. At the shop level, efficiency shows whether the job flow, the write-up process, and the handoffs supported the team.
Those levels should not be treated as interchangeable. A tech can look weak in isolation because the day was full of interruptions, while the shop total looks fine because other techs absorbed the drag. The opposite can happen too, with one star tech hiding a broken process somewhere else.
Read the combination, not the number
The most useful pattern is the one that points to a decision. High utilization with low efficiency usually means the shop is keeping people busy, but something in the write-up, labor guide, or workflow is off. Low utilization with high efficiency often means the tech works well when given a clean job, but the schedule or bay flow is starving the labor hours.
The International Labour Organization and the OECD both use output per labor input as the base logic, and the same framework appears in Eurostat's labor productivity measures. That shared framework keeps the owner focused on what changed, output or hours, rather than getting distracted by a single flattering number.
A good report also needs a comparison point that does not lie. Internal trends beat casual impressions, and a shop's own recent history is often more useful than a generic benchmark pulled from a different business model. For a broader context on how weak productivity shows up across businesses, you can.
Don't let one great week define the shop. The trend line matters more than the outlier.
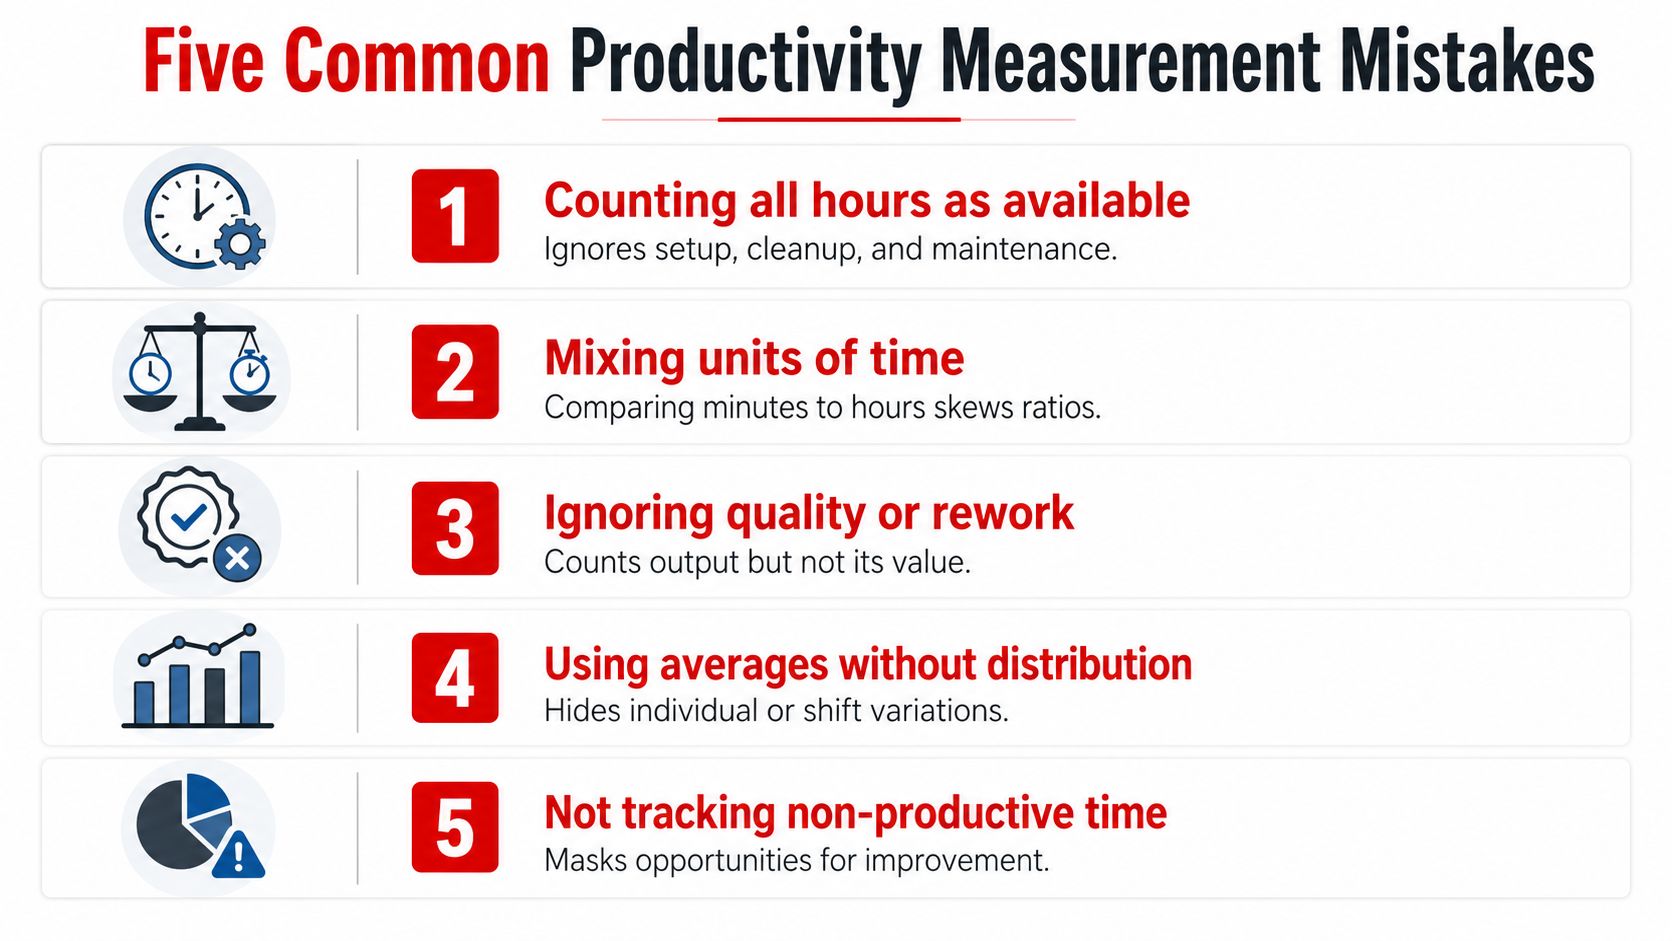
Five Calculation Mistakes That Skew Every Number
A productivity report can look clean and still send the owner in the wrong direction. The problem usually starts with the inputs, not the people. If the shop counts the wrong hours, mixes job types, or treats rework like good output, the ratio will flatter or punish the team for reasons that have nothing to do with real performance. Practical guidance also makes the same point on labor input, full-time, part-time, temporary, contractor, overtime, training, setup, maintenance, and other necessary non-productive time all need to stay visible if the comparison is going to mean anything.
The five distortions that show up first
Counting finished output without subtracting rework.
A report can show solid output while cash flow and comeback rates tell a different story. That happens when every job that left the bay gets counted as clean work, even if some of it came back. The fix is to remove rework and comebacks from the output side before treating the volume as productive.Mixing revenue and units in the same series.
A report that jumps from labor dollars to parts counts will never stay steady for long. Those are different measurements, and combining them breaks the comparison. Keep one unit system per series, then judge like against like.Comparing techs on different job complexity without adjustment.
One tech can look slow on paper and still be doing harder work all week. That usually comes from job mix, not effort. Track the gap by job type, shift, and skill tier so the report shows whether the difference came from complexity, not from the tech.Using clocked hours instead of actual worked hours.
Presence is not the same as productive labor. If the shop counts time in the building as if it were direct work, productivity will look better than it really is. Separate available time from productive time, and keep overtime, setup, maintenance, and training visible in the log.Ignoring non-productive time.
A tidy report can hide the reason the shop feels behind. Cleanup, maintenance, training, waiting, and setup all take labor away from billed work, even when nobody wants to label them as waste. Put those categories into the time log so the owner can see where the hours actually went.
The check that saves bad decisions
Good benchmarking needs a stable window, not a quick reaction to one busy or slow week. Practical guidance recommends looking at at least 8 to 12 weeks and using control limits or a similar stability check, because weekly swings often come from staffing changes or unusual events rather than a real shift in performance. That matters in a repair shop, because one stormy week, one vacation, or one heavy diagnostic cycle can distort the ratio if the owner moves too fast.
Before acting on any number, ask one question, “Did the work change, or did the measurement change?” If the answer is the measurement, clean up the report before changing the schedule.
Setting a Weekly Rhythm That Sticks
A productivity system only works when it fits the shop rhythm. Monday morning is a good time to pull the prior week's numbers, because the week is fresh enough to discuss and the next schedule is still open to adjustment. The point is not to create more admin work, it's to make the numbers visible before the same problems repeat.
A simple weekly template
| Field | What It Captures | Source |
|---|---|---|
| Week ending | The reporting period | Calendar |
| Available hours | Scheduled or present hours | Time clock |
| Productive hours | Direct labor time | Labor tracking |
| Billed hours | Charged labor hours | Repair orders |
| Utilization | Productive hours divided by available hours | Calculation |
| Efficiency | Billed hours divided by productive hours | Calculation |
| Revenue per labor hour | Labor revenue divided by labor hours | Invoices and time data |
| Notes | Delays, rework, training, interruptions | Manager review |
The review itself should stay short. Pull the numbers, compare them with the prior week, and ask which jobs or which handoffs drove the change. That keeps the team focused on action instead of debate.
Where software earns its keep
A tool like RedAppy fits this rhythm because it pulls labor and workflow data into one place instead of forcing the owner to stitch it together by hand. Its real-time analytics, technician efficiency tracking, and Digital Shop Board make the week visible, while the AI Repair Assistant can flag labor time variances as jobs are written so problems show up earlier, not after invoicing. That's especially useful in a shop where the manager wants the same numbers every Monday without adding another hour of admin.
A practical cadence is to review weekly and drill deeper monthly. Weekly, the owner watches utilization, efficiency, and any obvious schedule breaks. Monthly, the owner looks for patterns by technician, job type, and repeated delay. That keeps the shop from chasing noise while still catching the issues that matter.
RedAppy helps a shop owner see labor productivity, technician efficiency, and job flow in one place, without turning Monday morning into paperwork. If the goal is to price jobs better, schedule techs smarter, and spot waste before it eats profit, visit RedAppy and see how the platform fits a real repair shop workflow.
Ready to Transform Your Shop?
RedAppy helps auto repair shops create professional digital estimates with photos and videos, send them instantly via text or email, and get customer approvals in seconds. No credit card required to start.