
KPI Tracking Software for Auto Repair: The Complete Guide
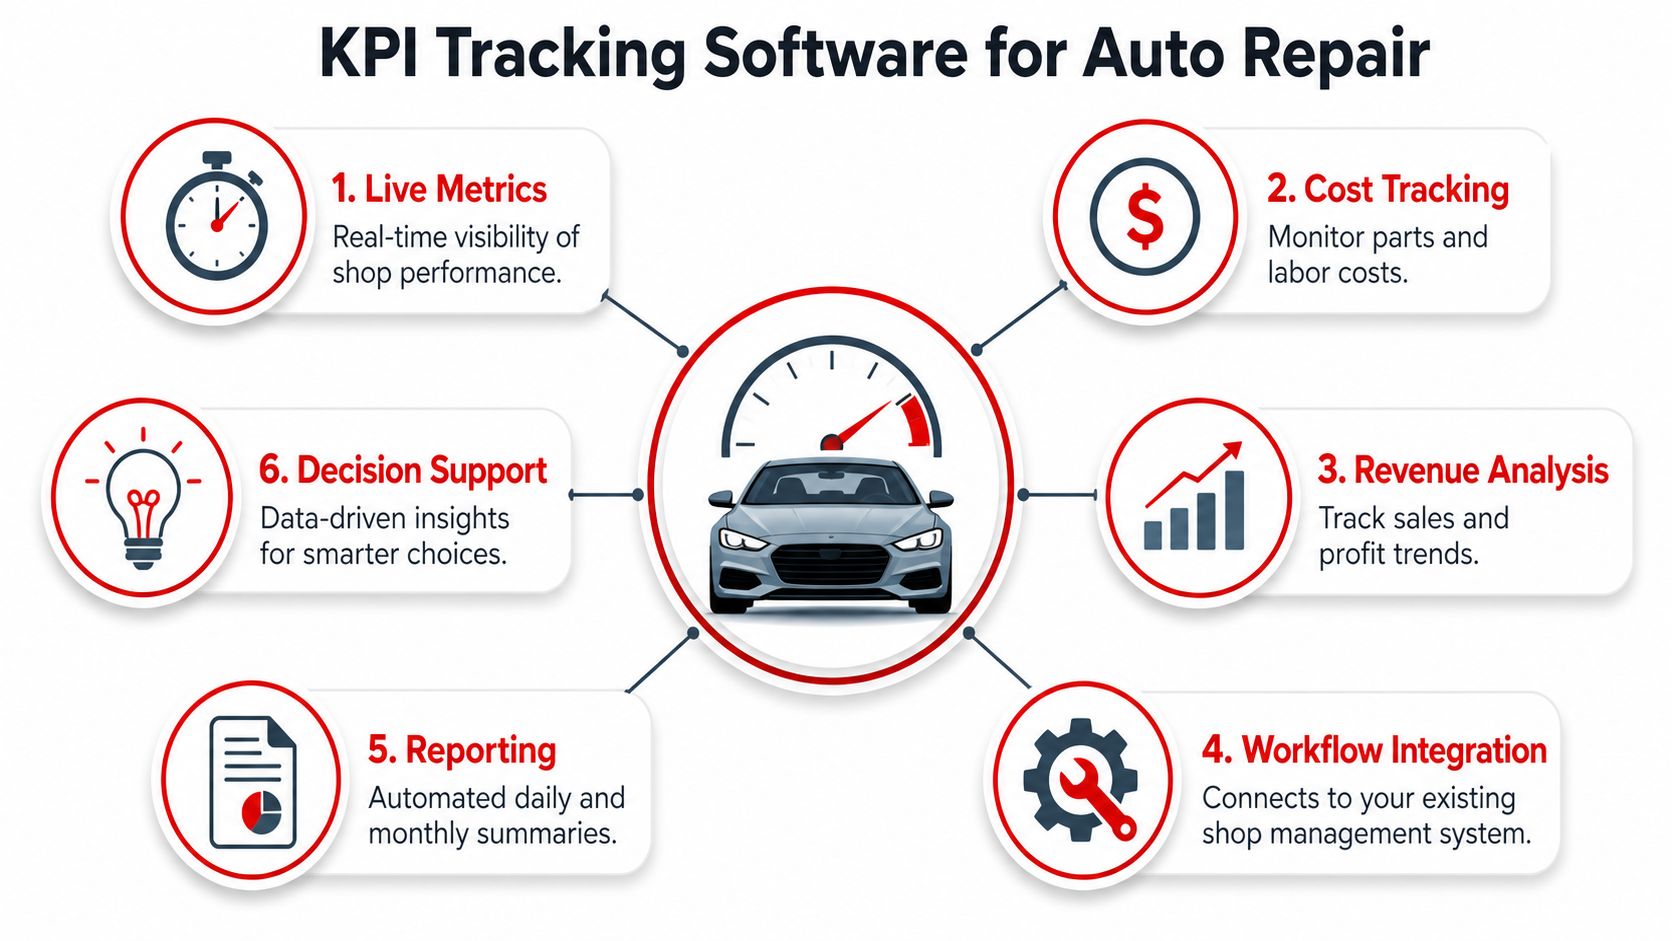
KPI tracking software is a centralized platform that connects a repair shop's operations, finance, and service data into live dashboards, replacing spreadsheets and exposing hidden inefficiencies. A practical system should also track the indicators that shape daily decisions, including average repair order, technician utilization and efficiency, parts gross profit, labor gross profit, and repeat business.
The need usually becomes obvious during an ordinary shop day. A service advisor is trying to remember last week's parts costs, a technician is waiting on a work authorization, and the owner is comparing a spreadsheet with the shop management system to understand why revenue looks healthy while cash feels tight. By Friday, someone is reconciling labor hours manually, correcting formulas, and deciding which version of the numbers deserves trust.
That workflow doesn't fail because shop owners lack discipline. It fails because the data sits in disconnected places and the definitions change from one person or location to another. KPI software should function as the shop's nervous system, carrying reliable signals from the front desk, service bay, parts operation, and financial records to the people making decisions.
Table of Contents
- Understanding KPI Tracking Software for Auto Repair
- Why Modern Repair Shops Need Live Metrics
- Essential Features to Look For in Your System
- Top Shop KPIs Every Owner Should Monitor
- Implementation Steps and Change Management
- Measuring ROI and Business Impact
- Building Your Path to Data-Driven Decisions
Understanding KPI Tracking Software for Auto Repair
A repair shop can finish a busy morning and still lack a reliable view of performance. The advisor sees vehicles waiting for approval, yet may not know how those decisions affect the day's revenue target. The foreman sees which technician is occupied, but not whether available labor hours are becoming billed hours. The owner sees total sales and then opens several spreadsheets to check parts margin, labor performance, and repeat business.
KPI tracking software brings those signals into one operating view. A useful platform creates one source of record, connects business context to each metric, and combines data from operations, finance, and service systems. That structure reduces spreadsheet reconciliation and gives teams consistent definitions for the numbers they use, as described in.
A basic reporting tool displays information. A working KPI platform connects a closed repair order with revenue, labor hours, parts costs, customer history, and the employee responsible for the next action. The result is a management signal that fits the shop's daily workflow, rather than another screen that only the owner checks at week's end.
The difference between reporting and control
A Friday report records what happened. A live scorecard can show technician hours falling behind while vehicles remain scheduled, or parts costs reducing margin before the month closes. Software supports control only when every metric has a clear definition, an assigned owner, an update cadence, and a specific response.
Practical rule: A dashboard earns its place when a named person can explain what a change means and what happens next.
Visual polish matters less than operating agreement. A screen full of gauges will not improve results if the team uses different definitions for a completed repair order or repeat business. Set those definitions first, then connect each measure to the advisor, technician, foreman, or owner who can act on it.
Why Modern Repair Shops Need Live Metrics
A Friday afternoon report tells you what happened. By then, a repair order may already have consumed unplanned labor, lost margin through parts costs, or stalled while waiting for customer approval. Live KPI tracking gives the owner and manager time to address those conditions while the work is still moving.
Manual reporting adds friction. Staff copy information between systems, retype figures, and reconcile different date ranges. Each handoff delays the view and creates opportunities for errors. Trusted multi-source integration brings operational, financial, and service data into one model, so managers can act from a shared version of the shop's performance.
The shop's nervous system only works when its signals reach the people doing the work. A service advisor needs open estimates, approval status, and average repair order. A technician needs assigned work, labor hours, and productivity context. An owner needs profitability, capacity, customer retention, and location comparisons. The same data can support all three roles, but each role needs a different decision view.

Live data still needs judgment
Real-time visibility does not mean every number should refresh constantly or trigger an alert. Frequent updates create noise when thresholds are poorly chosen, while large metric sets produce alert fatigue. A dashboard that warns about every small fluctuation teaches staff to ignore the warnings that require action.
Give each role a short list of decisions to manage:
- Service advisors: Which estimates need follow-up, and which approved jobs can move forward?
- Technicians and foremen: Where are labor hours being lost, and which jobs need support?
- Owners and managers: Which operational trend is affecting profit, capacity, or customer return behavior?
Research on dashboard adoption identifies unclear KPIs, weak visualization, outdated data, insufficient training, and poor workflow fit as common reasons teams stop using software. It also reports that 72% of managers still lack real-time visibility into team performance, showing that access to data alone does not change execution. The dashboard must match decisions made throughout the day, as discussed in. A green dashboard means little if advisors, technicians, and managers do not share metric definitions or know the next response.
Essential Features to Look For in Your System
A shop should evaluate KPI software against its actual workflow, not a vendor's feature count. The right platform connects data automatically, presents different views to different roles, and preserves consistent definitions as the business grows.
Start with the data foundation
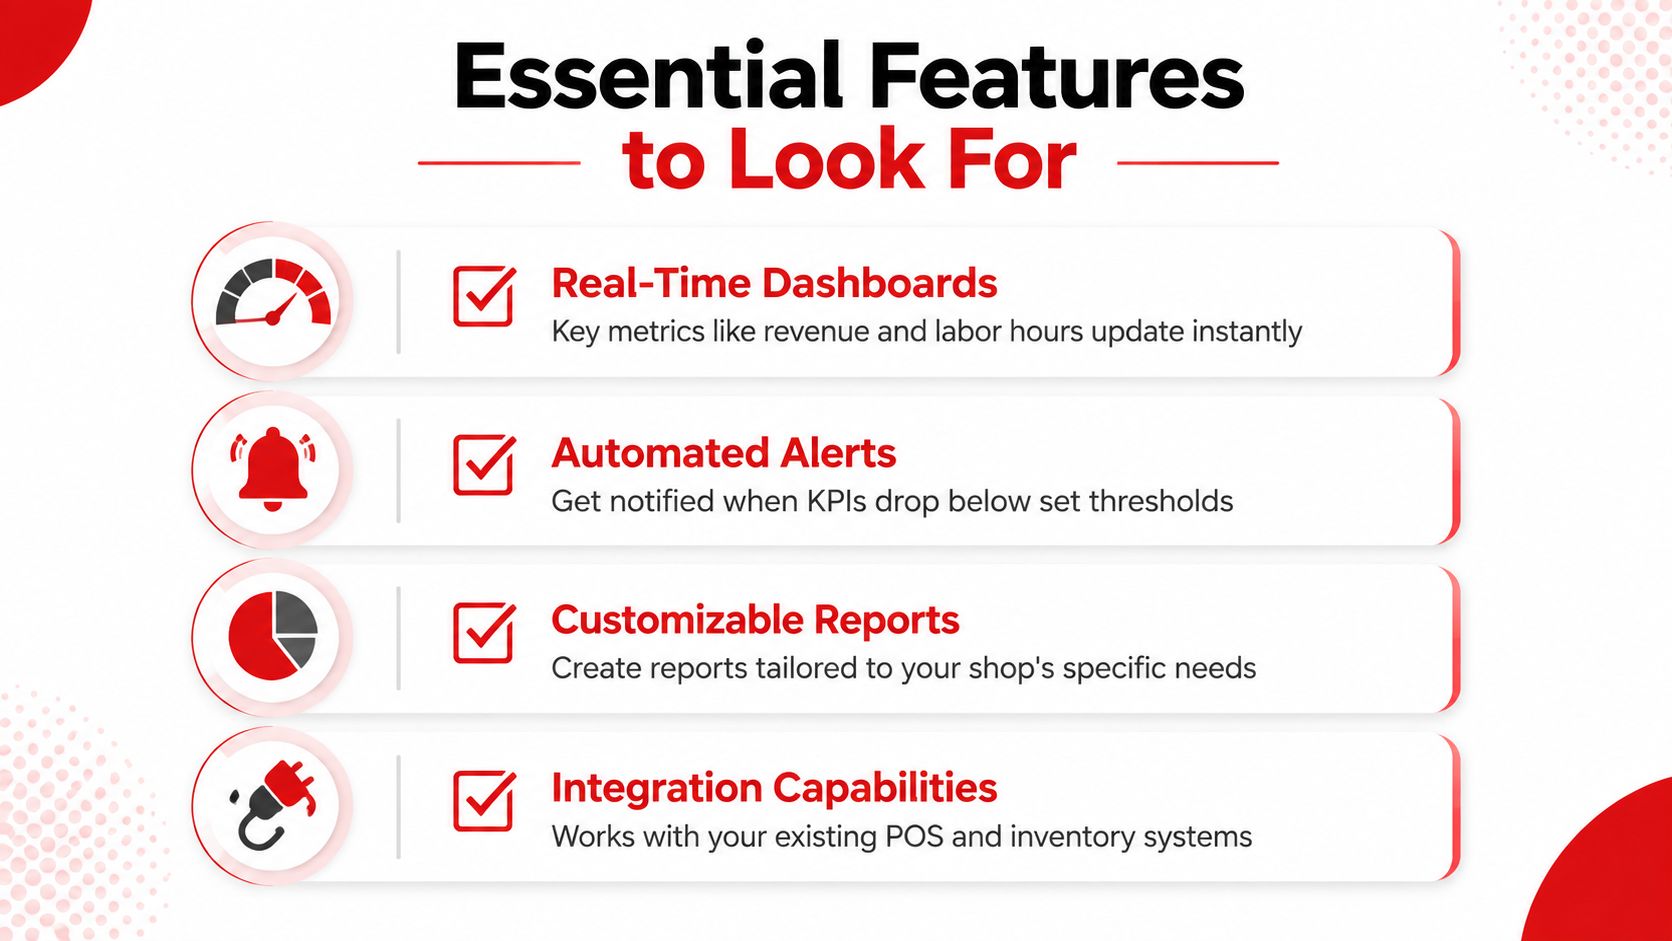
The first requirement is multi-source integration. The system should bring together shop management, point-of-sale, accounting, parts, labor, and customer information without forcing staff to maintain parallel spreadsheets. Integration isn't valuable merely because a connector exists. The imported fields must retain the context needed to interpret the metric.
Calculated KPIs are equally important. A platform should support formulas, breakdowns, targets, benchmarking, and alert-ready scorecards. Product analysis from notes that indicative benchmarks can help teams sense-check performance against typical sector patterns, but those comparisons are directional rather than true peer data. Internal trends should remain the basis for action.
Match the screen to the role
An owner's dashboard shouldn't look like a technician's work queue. Role-based views prevent staff from sorting through irrelevant information and make adoption more likely.
Look for:
- Live dashboards: Revenue, labor hours, repair orders, and other selected indicators update without repeated manual entry.
- Automated alerts: Thresholds notify the accountable person when a KPI moves outside an agreed range.
- Custom reports: Managers can examine a location, advisor, technician, vehicle category, or time period without rebuilding a spreadsheet.
- Mobile access: Owners and managers can review important signals away from the office.
- Drill-down context: A declining result leads to the repair orders, parts, labor entries, or customer records behind it.
Treat governance as a feature
Metric governance prevents the dashboard from becoming another source of disagreement. Every KPI needs a written definition, data source, owner, review cadence, and handling rule for exceptions. For example, a multi-location shop should define whether a repeat customer means a return within a particular business rule, and apply that rule consistently.
Complex models can also slow dashboards on large datasets. A system that loads slowly or requires technical support for every adjustment will lose credibility with the people who need it most. Teams looking for a broader approach to automated reporting can also, especially when reporting needs extend beyond the shop floor.
Top Shop KPIs Every Owner Should Monitor
A repair shop needs a balanced KPI set. Revenue alone can rise while margins fall. Technician activity can look strong while billed labor remains weak. Customer traffic can increase without producing durable repeat business. The owner's job is to connect financial, operational, and customer signals rather than reward one number in isolation.
| KPI | Definition | Benchmark Range |
|---|---|---|
| Average Repair Order | Total revenue divided by repair orders closed during the period | Benchmark bands commonly classify performance as below average, average, or top performer |
| Technician utilization | Hours worked divided by available hours | Use with efficiency to evaluate labor capacity |
| Technician efficiency | Hours billed divided by hours worked | Use with utilization to assess conversion of labor into paid work |
| Parts gross profit | Profit from parts after direct parts cost | 45% to 58% is published benchmark guidance for strong performance |
| Labor gross profit | Profit from labor after direct labor cost | 65% to 75% is often cited for well-priced shops |
| Customer retention | Repeat-customer activity tracked over a defined return window | Compare internal trends using one stable definition |
Revenue and margin
Average Repair Order, or ARO, equals total revenue divided by total repair orders closed in the period. It helps an owner distinguish a busy shop from a shop that creates sufficient value per visit. ARO should be read with car count and approval activity, because a higher average order can reflect better inspections, appropriate maintenance recommendations, or a change in the mix of work. The definition and benchmark grouping are outlined in.
Parts gross profit and labor gross profit reveal whether pricing and cost control support that revenue. Published guidance places strong parts gross profit around 45% to 58% and labor gross profit around 65% to 75%, as reported in. These are reference ranges, not automatic targets. Local pricing, vehicle mix, warranty work, supplier terms, and technician pay structure all affect interpretation.
Capacity and loyalty
Utilization and efficiency answer different questions. Utilization measures hours worked divided by available hours, while efficiency measures hours billed divided by hours worked. A technician can have high utilization but weak efficiency if the available time is filled without converting enough of it into billed work. SharpSheets explains the distinction between technician utilization and efficiency.
Customer retention adds the longer-term view. Repeat business signals whether customers return after the first visit and whether the shop's communication, inspection process, pricing, and repair quality support an ongoing relationship. Industry guidance places retention alongside ARO, gross profit, car count, and maintenance capture rate among the important shop health indicators, as detailed by.
Implementation Steps and Change Management
KPI software can be installed quickly and still fail completely. The difference lies in preparation, ownership, and whether the team sees the platform as a work aid or a surveillance device.
Two rollout paths are common. A gradual adoption path starts with one workflow, such as daily revenue and labor review, then expands after the team trusts the data. It reduces disruption and exposes definition problems early, but it can leave the business running two systems for longer. A full rollout standardizes the platform across the shop immediately, which creates a common operating model faster, but it demands cleaner data, stronger training, and more management attention.
A practical rollout sequence
Assess the current workflow. Document how repair orders move from check-in to estimate, approval, repair, invoicing, and payment. Identify where staff retype information or make judgment calls that should become consistent rules.
Choose and configure with staff input. Ask advisors, technicians, foremen, and owners which decisions they need to make each day. Configure views around those decisions instead of importing every available field.
Train through real shop situations. Use a closed repair order, a delayed part, an unapproved estimate, and a returning customer as training examples. Staff should learn how to interpret a KPI and act on it, not just where to click.
Review adoption and definitions. Hold a regular review that checks whether the numbers remain trustworthy, whether alerts are useful, and whether people are using the views assigned to them. Update the configuration when the workflow changes, without casually changing the metric definition.
Adoption depends on trust. Technicians and advisors are more likely to use a dashboard when managers explain what the metric measures, how it will be used, and what support follows a weak result.
A small pilot can prove the workflow before expansion. Full rollout makes sense when multiple locations already share stable definitions and the leadership team can provide consistent support. Neither path works if the shop skips data cleanup or treats training as a one-time product demonstration.
Measuring ROI and Business Impact
The return from KPI software shouldn't be judged by logins or attractive screens. The business case should connect a software capability to a measurable operational change, then connect that change to financial impact.
Start with the baseline. Record how much administrative time the team spends collecting, cleaning, and distributing reports. Note how long it takes to identify an approval bottleneck, reconcile labor hours, or explain a margin movement. The baseline doesn't need to be perfect. It needs to be consistent enough to compare the old process with the new one.
Build an impact chain
A useful ROI review follows a simple chain:
- Capability: Automated data integration removes repeated copying between systems.
- Operational change: Staff spend less time assembling reports and more time following up on work.
- Business result: Managers can address delayed approvals, idle capacity, or pricing issues sooner.
- Financial effect: The shop compares the resulting revenue, margin, or labor improvement against the software and implementation cost.
The same method applies to cycle time. If the dashboard reveals where vehicles wait for authorization, parts, diagnosis, or final inspection, the manager can measure whether the response becomes faster. The KPI isn't valuable because it moved. It's valuable because someone changed a process that affected the customer and the shop.
Avoid green dashboards with flat profits
Governance determines whether the ROI analysis means anything. If the definition of an approved repair order changes halfway through the comparison, an apparent improvement may reflect a reporting change rather than a business result. Recent coverage warns that dashboards can turn green while outcomes stay flat when software measures activity instead of decision quality, making metric stability a central part of the business case, as discussed in.
A monthly review should ask which decisions the system improved, which alerts people ignored, and which metrics failed to explain the result. That conversation is more useful than celebrating dashboard usage in isolation.
Building Your Path to Data-Driven Decisions
A shop doesn't become data-driven by buying more dashboards. It becomes data-driven when the team agrees on a small set of meaningful signals, trusts the underlying definitions, and uses those signals during real operating decisions.
The first step is to choose the business problem. An owner may need better visibility into labor capacity. A service manager may need to improve estimate follow-up. A multi-location operator may need one definition of ARO, parts margin, or repeat business across every site. Each goal points to a different starting configuration.
Keep the system close to the work
The most useful dashboard is the one people can interpret without leaving their normal workflow. Advisors should see open opportunities and customer context. Technicians and foremen should see labor and job status. Owners should see the relationship between sales, margin, capacity, and retention.
That role-based approach also protects the shop from metric overload. Adding more widgets can reduce trust when employees can't tell which number matters. A compact scorecard with a clear owner and threshold is often more actionable than a large collection of attractive but disconnected charts.
Make improvement continuous
KPI governance needs ongoing attention. When labor flags change, repair-order rules evolve, a location adopts a different process, or customer-return windows shift, the definition must be reviewed before the dashboard is used for comparison. Stable definitions let managers distinguish a real operational change from a data configuration problem.
The same discipline applies to benchmarking. Indicative sector benchmarks can provide a useful sense-check, but internal trends show whether a specific shop is improving under its own conditions. Managers should compare results with context, then attach a practical action to the finding.
A sensible starting sequence is:
- Select a focused scorecard tied to one business priority.
- Assign ownership for each metric and its follow-up action.
- Connect trusted data sources before adding visual complexity.
- Test the views with the people who use them daily.
- Review decisions and outcomes, not just dashboard activity.
- Expand only after the first workflow earns confidence.
KPI tracking software works best as a living operating layer. It connects the front desk to the service bay, the repair order to the financial result, and the customer visit to the long-term relationship. The technology creates visibility, but shop leaders create value by deciding what the signals mean and acting while there's still time to change the outcome.
RedAppy offers shop management features that connect digital inspections, estimates, invoicing, payments, parts ordering, workflow boards, and real-time analytics for revenue, technician efficiency, average repair order, and repeat business. Visit RedAppy to review the platform, explore its features, or contact the team about fitting KPI tracking into the shop's daily workflow.
Ready to Transform Your Shop?
RedAppy helps auto repair shops create professional digital estimates with photos and videos, send them instantly via text or email, and get customer approvals in seconds. No credit card required to start.