
Labor Cost Analysis for Auto Repair Shops
Monday morning starts with three bays full, two technicians tied up on warranty work, and a service writer passing over another write-up. The owner sees cars moving, payroll running, and labor sales appearing on the report, yet the margin won't budge. The problem usually isn't a single bad repair order. It's the gap between what the shop pays for labor, what technicians produce, and what the business collects.
That gap makes labor cost analysis more than a wage review. It's a capacity analysis, a pricing test, and a way to find revenue that paid hours should have produced. The useful numbers are effective labor rate, technician productivity, burdened labor cost, and labor gross margin. Each one answers a different question, and together they show whether a shop has a payroll problem, a workflow problem, or a pricing problem.
Table of Contents
- What Labor Really Costs Your Shop
- Gathering the Right Data Before You Calculate
- The Core Formulas That Drive the Numbers
- Benchmarks That Tell You If the Numbers Are Healthy
- Troubleshooting the Leaks You Will Find
- Turning the Analysis Into a Profit Plan
- Quick Answers to the Questions Shop Owners Ask First
- How often should labor cost percentage be recalculated?
- What's the fastest way to split flat-rate and hourly technicians?
- Should the owner's salary be included?
- How does warranty work distort productivity?
- What should a shop do with fewer than 100 paid labor sales a month?
- How can an owner tell whether a low effective labor rate is a pricing problem or a discount problem?
What Labor Really Costs Your Shop
A technician's hourly wage is only the visible starting point. The shop also pays payroll taxes, workers' compensation, health insurance, uniforms, paid vacation, retirement contributions, training, and other employer-paid costs. The U.S. Bureau of Labor Statistics defines the Employment Cost Index as a measure of changes in hourly labor costs, including wages and non-wage compensation, which makes it a useful reference when reviewing labor cost beyond cash pay alone.
Capacity creates another cost that payroll rarely presents clearly. A technician can be clocked in while waiting for authorization, locating a part, moving a vehicle, cleaning a bay, correcting a parts issue, or completing paperwork. The shop pays for that time even when it produces no billed labor. Warranty work and comebacks apply the same pressure, consuming paid capacity without producing customer-pay revenue.
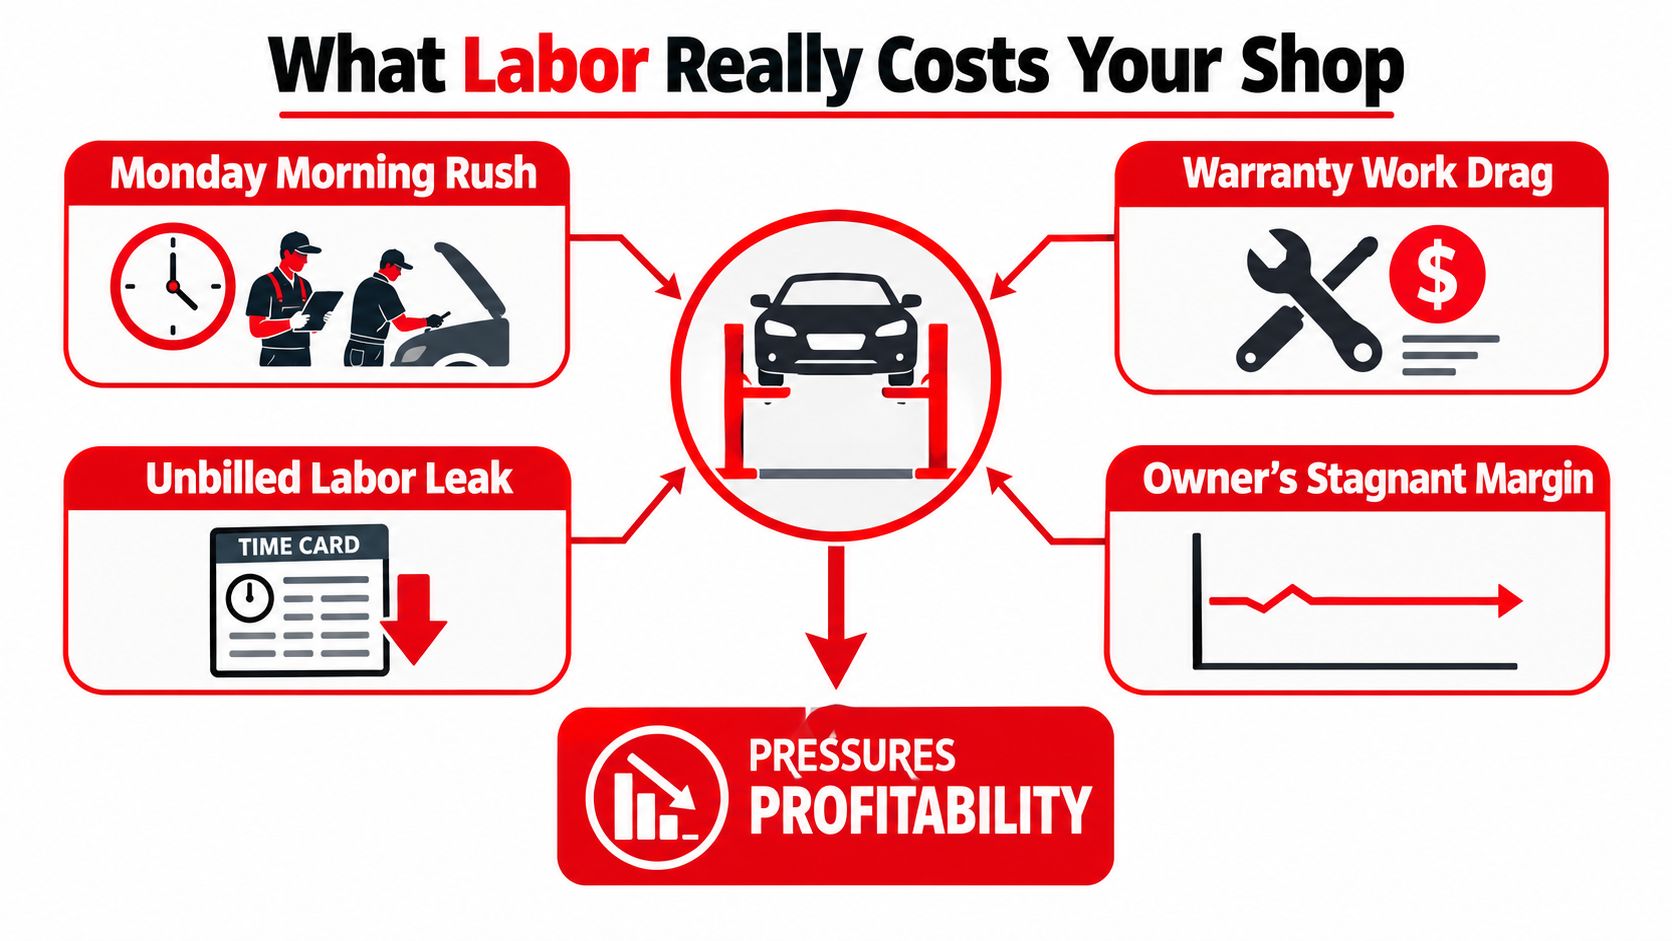
The four numbers that expose the gap
Effective labor rate shows what the shop collects for each labor hour sold, rather than the rate printed on the menu. Discounts, goodwill, warranty adjustments, and underpriced operations can push the collected rate below the posted rate.
Technician productivity compares billed hours with hours worked. It shows whether available technician capacity becomes sold output, connecting payroll time to labor revenue.
Burdened labor cost captures the full employer cost of an hour. Reviewing base wage alone leaves benefits and employment expenses out of the P&L.
Labor gross margin shows what remains after loaded labor cost is removed from labor revenue. It connects pricing and technician output to the profit available from labor.
Practical rule: A higher wage can improve shop economics when it supports stronger productivity and fewer comebacks.
Retention belongs in the calculation. Replacing an experienced technician brings recruiting, onboarding, training, and lost-capacity costs that a wage-only spreadsheet misses. For practical ideas on reducing avoidable turnover, shop owners can review.
RedAppy can turn these measures into one-click actions, helping owners connect the numbers to rate changes, scheduling adjustments, operation-code corrections, warranty handling, or staffing decisions. A clean weekly view shows whether labor pressure comes from wages, unused capacity, weak pricing, or output that never becomes collected revenue.
Gathering the Right Data Before You Calculate
Bad inputs produce confident-looking nonsense. A shop should gather the source records first, then calculate the ratios, rather than trusting a dashboard that blends payroll, invoicing, and technician activity without showing how each figure was built.
Start with paid time, not scheduled time
The payroll register provides gross wages, taxes, benefits, and employer-paid items. The time-clock export provides actual hours worked. Scheduled hours are useful for planning, but they shouldn't replace clocked hours in a labor cost analysis. A technician scheduled for a full shift may leave early, stay late, or spend part of the shift on nonproductive work.
The shop management system supplies invoices, job cards, labor sales, operation codes, billed hours, discounts, and warranty adjustments. Technician clock time and flagged time must remain separate. Clock time measures paid capacity. Flagged time measures sold output. Combining them destroys the productivity signal.
Parts markup and total repair-order value belong in the gross-margin denominator when the shop is reviewing the whole job, but they aren't labor inputs. A parts-heavy repair order can make labor look healthy as a share of total sales while the shop still undercharges for technician time.
Build a clean input set
A single clean week is more useful than several months of records containing missing punches, inconsistent operation codes, and unclassified warranty work. Before calculating, confirm that the selected period uses the same dates across payroll, time-clock, invoices, and job cards.
| Data Sources vs. What They Actually Feed | Feeds These Calculations |
|---|---|
| Payroll register | Gross wages, payroll taxes, benefits, paid time off, loaded labor cost |
| Time-clock export | Actual hours worked, paid capacity, technician productivity |
| Invoices and job cards | Labor revenue, billed hours, effective labor rate |
| Operation codes | Booked time, flagged time, operation-level variance |
| Warranty records | Warranty labor revenue, write-downs, labor gross margin |
| Parts and repair-order totals | Whole-job margin context, not labor-hour inputs |
A useful pre-flight checklist is short:
- Payroll: Include wages and employer-paid labor costs.
- Time: Use actual clocked hours, with missed punches identified.
- Sales: Separate customer-pay, internal, and warranty labor.
- Output: Capture billed hours by technician and operation.
- Adjustments: Mark discounts, goodwill, comebacks, and write-downs.
- Period: Use matching dates across every export.
Gut feel still matters, but it's a starting question, not a measurement system. The records should explain why the owner feels busy while the margin remains flat.
The Core Formulas That Drive the Numbers
Four formulas connect labor cost with shop capacity. Use them together, because a strong margin can still hide unused technician time, while high productivity can fail to produce cash if the collected rate is weak.
Effective labor rate
Effective labor rate = total actual labor revenue ÷ total labor hours sold.
A shop may post a $120 labor rate yet collect $9,500 from 100 billed hours. Its effective labor rate is $95. Discounts, warranty pricing, goodwill, and underpriced operations explain the gap. The posted rate is a menu figure. The collected rate is what reaches the P&L.
Technician productivity
Technician productivity = billed hours ÷ hours worked.
A technician who works 40 hours and produces 44 billed hours has productivity of 110%. Shops often call this billable efficiency. Utilization measures how much time was assigned to productive work. Productivity compares paid time with billed output. A technician can stay occupied all day and still generate too few billed hours when dispatching is poor, jobs wait on parts, or work is under-flagged.
That distinction matters because capacity is a labor-cost issue. Unbilled technician time still carries wages and overhead, even when the schedule appears full.
Burdened labor cost
Burdened labor cost per hour = total loaded labor expense ÷ actual hours worked.
Loaded expense includes gross wages, payroll taxes, benefits, paid time off, workers' compensation, retirement contributions, uniforms, and other labor-related expenses. Employer labor cost extends beyond cash wages, as noted earlier.
Labor gross margin
Labor gross margin = (labor revenue minus burdened labor cost) ÷ labor revenue.
Consider one technician who works 40 hours, bills 44 hours, and generates $4,400 in labor revenue at an effective labor rate of $100. With fully loaded weekly labor expense of $1,600, loaded cost is $40 per worked hour and labor gross margin is 63.6%.
| Worked Example: One Tech, One Week | Formula | Example Result |
|---|---|---|
| Effective labor rate | $4,400 ÷ 44 billed hours | $100 per billed hour |
| Technician productivity | 44 billed hours ÷ 40 worked hours | 110% |
| Burdened labor cost | $1,600 ÷ 40 worked hours | $40 per worked hour |
| Labor gross margin | ($4,400 - $1,600) ÷ $4,400 | 63.6% |
If the technician bills 48 hours at the same collected rate, labor revenue rises to $4,800 while loaded expense stays the same, improving margin. Raising the posted rate does less if the shop continues collecting $95. For job-level margin controls, see.
Unit labor cost adds the output test: compare compensation with what the team produces, rather than reviewing wages alone. BLS manufacturing data tracks that relationship over time. A repair shop can apply the same principle to billed hours, completed operations, and vehicles delivered. RedAppy can connect those inputs so an owner sees the variance and acts on it without rebuilding the spreadsheet.
Benchmarks That Tell You If the Numbers Are Healthy
Benchmarks are useful only when they help an owner decide what to change. A single ratio rarely does that. Labor cost as a percentage of sales can move because vehicle mix, parts revenue, pricing, or seasonality changed. It doesn't necessarily show whether technicians worked efficiently.
The same caution applies to labor cost per vehicle. Automotive analysts use it because it combines wage rates and productivity into one operational measure, but labor cost as a percentage of revenue can still hide capacity problems. Pair financial allocation with output measures such as billed hours, vehicles completed, and real billable hours.
Read the numbers as a set
| Labor Benchmarks: Weak vs. Average vs. Strong Shops | Weak Shop | Average Shop | Strong Shop |
|---|---|---|---|
| Billable efficiency | Paid time regularly produces less billed output | Output is stable but uneven by technician | Billed output consistently reflects available capacity |
| Labor cost share | Labor consumes too much of sales for the work delivered | Labor share is monitored with sales mix | Labor share is paired with productivity and margin |
| Profit per technician | Trend moves down or remains unexplained | Results fluctuate with workflow | Results remain stable as capacity and pricing are managed |
The right question isn't whether total labor sales increased. It's whether revenue per labor hour, productivity, and labor gross margin moved in the same direction. A shop can sell more labor while earning less per paid hour if it adds discounts, absorbs warranty work, or allows rework to consume capacity.
Recent BLS data illustrate the broader principle. In one reported period, labor productivity rose 3.3% while unit labor costs still increased 1.0%, because hourly compensation rose 4.3%. The shop-level lesson is direct: wage growth doesn't automatically equal damaging cost growth. The result depends on whether output improves enough to offset the compensation increase.
A useful Monday review therefore asks three questions: Did billed hours per paid hour improve? Did collected labor revenue keep pace? Did loaded labor cost consume more or less of the revenue? Those answers are more actionable than a headline labor-sales total.
Troubleshooting the Leaks You Will Find
Once the formulas show a gap, the owner needs a diagnostic path. The fastest method is to start with the number that moved, then trace the workflow that creates it.
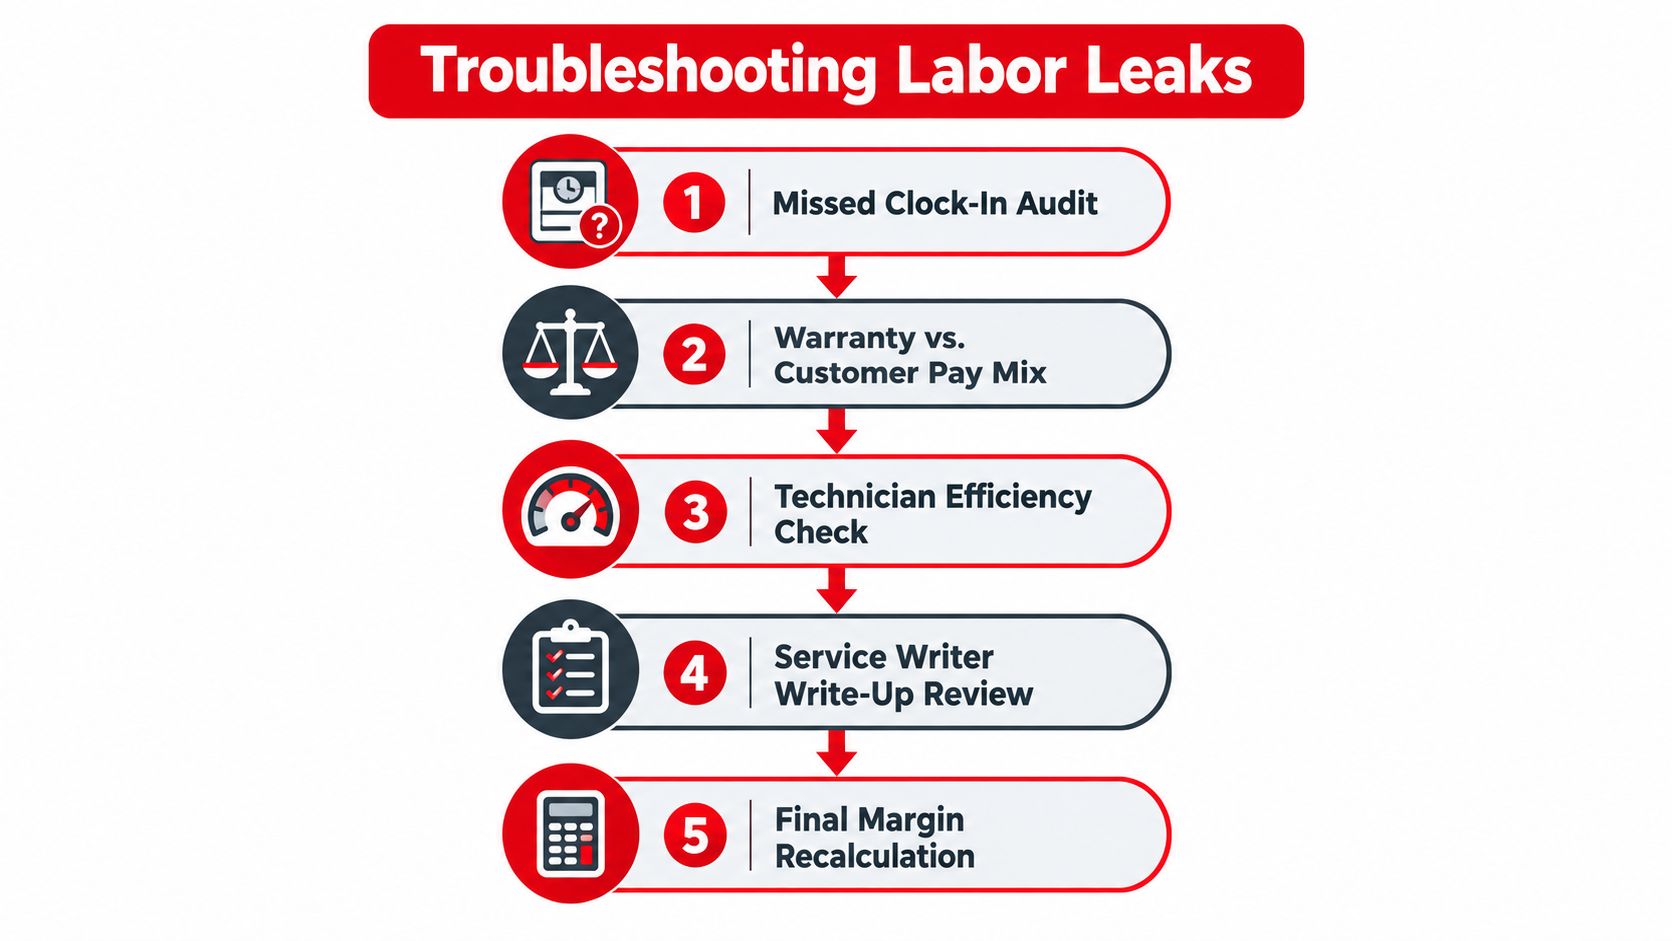
Audit the clock before blaming the technician
Compare clocked hours with payroll hours and job-card activity. A missed clock-in, an after-hours repair, or a technician who works through a job transition can create paid time that never reaches a labor sale. The calculation is straightforward: unbilled paid hours × effective labor rate. If 10 paid hours weren't billed at a $100 effective rate, the visible revenue gap is $1,000.
The fix is operational, not motivational. Require same-day clock corrections, give the service manager responsibility for reviewing exceptions, and separate waiting time from repair time instead of allowing both to disappear into one timecard.
Review operations where booked time misses actual effort
Pull operation codes with a meaningful difference between book time and actual time. A variance above 15% deserves review, especially when the operation appears repeatedly across technicians. The cause might be outdated labor-guide time, difficult vehicle access, missing diagnostic steps, or an advisor selling a complex job as a simple one.
The fix can include revising operation codes, adding diagnostic lines, or changing the estimate structure. A shop shouldn't ask a technician to “be faster” when the operation itself is mispriced.
Isolate flag time that produces no revenue
Flagged time should connect to an invoice or an approved internal category. Time spent on setup, moving vehicles, parts delays, or unpaid inspections may be legitimate, but it needs a label. Without one, the owner can't distinguish dispatch friction from technician performance.
Track comebacks by technician and operation
A comeback consumes capacity twice. Compare comeback hours with original billed hours, then classify the reason, such as parts failure, diagnostic error, installation mistake, or customer concern. If a technician produces strong billed hours but also generates repeated rework, the productivity number is overstated economically.
Warranty write-downs need the same treatment. Separate warranty labor from customer-pay labor and calculate the margin after the adjustment. A shop that reports only total billed hours can miss how warranty terms reduce the collected rate.
Diagnostic rule: Run the benchmark, identify the gap, then audit the workflow that creates that specific gap. Don't apply a pricing fix to a timekeeping problem.
Turning the Analysis Into a Profit Plan
A useful labor cost analysis should produce a calendar, not another report. A 30-60-90 day plan gives the owner enough structure to improve the data first, correct the leaks second, and automate the review after the operating habits are stable.
Days 1 through 30 focus on data integrity
The shop should standardize time-clock corrections, verify payroll synchronization, clean up operation codes, and separate customer-pay, internal, and warranty labor. The service manager should review labor cost, effective labor rate, productivity, and gross margin every week using the same definitions.
The first month isn't the time to chase every weak result. It's the time to make sure the result is real.
Days 31 through 60 target the leaks
Once the records are dependable, the shop can retrain advisors on operation selection, set productivity expectations by technician, review warranty terms, and adjust labor rates by service category where the mix shows underpricing. A rate increase won't solve missed clock-ins, and a productivity target won't solve a labor guide that doesn't reflect the work.
Digital vehicle inspections can help surface additional needed work with photos and technician findings. That can improve the estimate conversation and give the shop more legitimate labor opportunities, rather than relying on pressure to sell more work.
Days 61 through 90 make the rhythm visible
The manager can place a live performance view where the team sees it, review labor gross margin weekly rather than monthly, and connect technician incentives to billed efficiency and comeback quality. The point isn't to reward raw hours while ignoring rework. It's to reward productive, accurate work that supports the P&L.
RedAppy combines digital vehicle inspections, estimates, invoicing, parts workflows, analytics, technician efficiency reporting, and an AI Repair Assistant that provides labor times and repair guidance using labor information and shop history. That makes it one practical option for turning labor cost analysis into a daily workflow instead of a quarterly spreadsheet exercise. Shop owners can compare those capabilities with their current process on the RedAppy features page.
Quick Answers to the Questions Shop Owners Ask First
How often should labor cost percentage be recalculated?
Review it weekly using the same labor categories and date range. Monthly reporting is useful for trend analysis, but it's too slow for correcting a scheduling or pricing leak that started this week.
What's the fastest way to split flat-rate and hourly technicians?
Keep paid hours and billed hours separate for every technician, then calculate productivity by pay structure. Flat-rate technicians need billed output compared with available time, while hourly technicians still require the same output measure to show whether paid capacity became sold labor.
Should the owner's salary be included?
Include the owner's compensation when the analysis is meant to show the true cost of operating the business. Exclude it only from a manager-level view designed to compare technician labor performance. The report should label both versions clearly.
How does warranty work distort productivity?
Warranty work can create billed activity without producing the same collected labor revenue as customer-pay work. Separate warranty hours, warranty revenue, and write-downs, then calculate the effective labor rate for each category. If the warranty mix grows, review the agreements and operation codes before judging technician output.
What should a shop do with fewer than 100 paid labor sales a month?
Use a rolling view rather than reacting to a single repair order. Track every labor sale, but wait for a consistent pattern across several review periods before changing staffing or pricing. Small shops should focus first on clean time records and missed billing, because one unbilled operation can distort the period.
How can an owner tell whether a low effective labor rate is a pricing problem or a discount problem?
Reconcile posted labor revenue with collected labor revenue by operation and adjustment type. If the operation price is low before discounts, it's a pricing problem. If approved prices are repeatedly reduced through discounts or goodwill, it's an adjustment problem. Set an approval rule for discounts and investigate any category that consistently falls below the shop's intended rate.
The first week should end with a short operating checklist: verify paid hours, reconcile labor sales, calculate the effective rate, review productivity, separate warranty work, and inspect comebacks. A shop doesn't need more vanity metrics. It needs a dependable connection between paid capacity, sold output, and collected margin.
RedAppy brings digital inspections, estimates, invoicing, technician analytics, parts workflows, and AI-assisted repair information into one shop-management workflow, so labor performance can be acted on while the vehicle is still in the bay. Visit RedAppy to see how the platform can replace disconnected spreadsheets with clearer daily decisions about labor, capacity, and margin.
Ready to Transform Your Shop?
RedAppy helps auto repair shops create professional digital estimates with photos and videos, send them instantly via text or email, and get customer approvals in seconds. No credit card required to start.