
Operational Efficiency Improvement for Auto Repair Shops
You can walk into a clean bay and still lose money before lunch. The advisor retypes the VIN into two systems, a tech waits on a part run, a customer calls for an update, and three small delays stack into one ugly day. Operational efficiency improvement in a repair shop isn't about working faster for its own sake, it's about creating more value per labor hour, with fewer handoffs, fewer reworks, and fewer surprises.
That's the lens that matters in a shop. A bay can look busy and still underperform if technicians spend too much time waiting, if estimates bounce back and forth, or if customers hesitate because the process feels messy. Stronger efficiency shows up in cycle time, technician efficiency, and average repair order, not just in how hard everybody looks at 4 p.m.
A useful way to think about the fix is simple. Diagnose waste, measure the right KPIs, redesign the workflow, put software where it supports the process, then prove the ROI in dollars. That order matters because tools don't rescue a broken process, they usually expose it.
Independent owners, multi-location operators, service advisors, and mobile mechanics all face the same problem in different clothes. The details change, but the job is the same, cut the friction that steals labor hours and customer trust. For owners in Australia and New Zealand who want a profit-focused view of that problem, the is a useful outside resource to compare with what's happening inside the bays.
Table of Contents
- Why Most Repair Shops Leak Margin Before They Notice
- Diagnose Waste From Check-In to Checkout
- The Three KPIs That Actually Move a Shop Forward
- Redesign Workflow Before You Buy Another Tool
- Roll Out Shop Management Software Without Burning the Team
- Prove ROI in Dollars the Owner Can Actually Show
- Your Operational Efficiency Checklist and Next Step
Why Most Repair Shops Leak Margin Before They Notice
The leak usually starts at the front counter. A customer hands over keys, the advisor asks the same questions again, the VIN gets typed into multiple systems, and the technician eventually inherits a job that already lost time before the hood was opened. That is not a speed problem alone, it's a value-per-labor-hour problem.
Shops often mistake motion for progress. A full board, a ringing phone, and a packed parking lot can hide the fact that people are re-entering data, chasing approvals, or walking back and forth for information that should already be in one place. Efficiency improves when each labor hour turns into billed, approved, and completed work, not just visible activity.
What the efficiency benchmark really says
Industry reporting shows that 75% of organizations say they improved efficiency after implementing operational strategies, and businesses with high operational efficiency were reported to have 30% higher profit margins on average. The same dataset says broader efficiency improvements can cut costs by up to 25%. Those numbers matter because they connect cleaner operations directly to margin, pricing flexibility, hiring room, and investment capacity. (operational efficiency benchmark)
Practical rule: If a process change makes the shop faster but creates more callbacks or more customer confusion, it's not efficiency. It's hidden rework.
That's why the five-stage approach works better than random fixes. First, diagnose waste. Then, measure the few KPIs that move the floor. After that, redesign the workflow, adopt the tools that fit the new flow, and prove the outcome in dollars. Shops that skip the first two steps usually buy software to automate confusion.
A shop owner doesn't need a management consulting deck to start. The question is simple, where is labor getting trapped without creating value? Once that's clear, the right changes stop feeling abstract and start looking like better days at the front desk, fewer stalled jobs, and a cleaner handoff from advisor to tech to customer.
Diagnose Waste From Check-In to Checkout
The fastest way to see waste is to follow one car the way it moves. Not the ideal path on the wall, the one from greeting to delivery. The job passes through eight touchpoints, and each one can leak time through waiting, rework, duplicate entry, or pointless motion.
Map the full job lifecycle
At greeting, waste usually shows up as a line at the counter or a customer waiting while staff search for history. At vehicle intake, the common problems are duplicate data entry and missing details that force a second round of questions later. During digital inspection, the big leak is rework, especially when notes are incomplete or photos don't match the concern.
Estimate approval often stalls because the customer gets a vague explanation and needs another call. Parts sourcing creates its own delays when a tech or advisor has to check inventory with more than one vendor, then walk away and come back again. Repair breaks down when the job priority isn't obvious, quality check exposes missed steps, and delivery can become a scramble if invoicing and payment aren't ready.
A value-stream map doesn't need software. A notepad works. Draw each touchpoint, write the wait time next to it, and mark where work gets copied, sent back, or physically moved without adding value. That alone usually makes the bottlenecks obvious.
A brake job example that every shop recognizes
A brake job starts with a paper inspection, gets retyped into the POS, then gets reviewed again because the customer wants photos. A tech walks back to the parts window twice, once for confirmation and once because the first part pull wasn't complete. The job didn't fail because of weak workmanship, it failed because the process asked for the same effort more than once.
Use four waste labels on each step, waiting, rework, duplicate entry, and unnecessary motion. Those four categories cover most of the friction that makes a busy shop feel behind even when everyone is moving. The goal is not to eliminate every pause, it's to remove the pauses that don't create value for the customer.
The best takeaway is a one-page map that can be built before the day ends. If the map shows where jobs stall, the shop can fix the flow before it buys another dashboard.
The Three KPIs That Actually Move a Shop Forward
Shops drown in dashboards because dashboards are easy to buy and hard to use. A working manager needs only three weekly numbers that tie directly to cash and customer experience, technician efficiency, average repair order, and cycle time. Anything beyond that should earn its place.
What each KPI tells the owner
Technician efficiency shows how much billed work a tech produces relative to the hours present on a job. It matters because unbilled time, waiting time, and unclear assignments all lower the return on labor. The trap is measuring this before the estimating process is clean, because that can punish advisors for approving the right work and make the shop chase the wrong problem.
Average repair order, or ARO, shows how much revenue each closed order carries. It tells the owner whether the shop is capturing the work the car needs, or leaving money on the table with weak inspections and unclear presentation. If the ARO is flat while the parking lot is full, the shop may be busy without being profitable.
Cycle time tracks the path from drop-off to delivery. It matters because customers feel delays immediately, and slow turnarounds strain bays, loaners, and follow-up calls. The trap is optimizing cycle time while ignoring comeback rates, because a fast but sloppy job still costs time and trust.
Track the cleanest process first, then judge the people inside it. Otherwise, the metric blames the team for a system problem.
A multi-location chain can compare stores more easily because its process is usually more standardized. An independent shop needs a baseline, then a trend line. The right wall number for Monday is usually cycle time, because customers feel it and the team can influence it daily. The number that should never be quoted to a customer as a promise is technician efficiency, because it's an internal management metric, not a service commitment.
| KPI | What It Measures | What Moves It |
|---|---|---|
| Technician efficiency | Billed output versus hours available on the job | Clear estimates, fewer delays, better job assignment |
| Average repair order | Revenue per closed ticket | Strong inspections, better presentation, approved add-ons |
| Cycle time | Time from drop-off to delivery | Parts readiness, fast approvals, fewer handoff gaps |
For shop owners who want a cleaner reporting stack, a can help frame how reporting should support action instead of noise. The point isn't more charts. It's fewer numbers that change decisions.
Redesign Workflow Before You Buy Another Tool
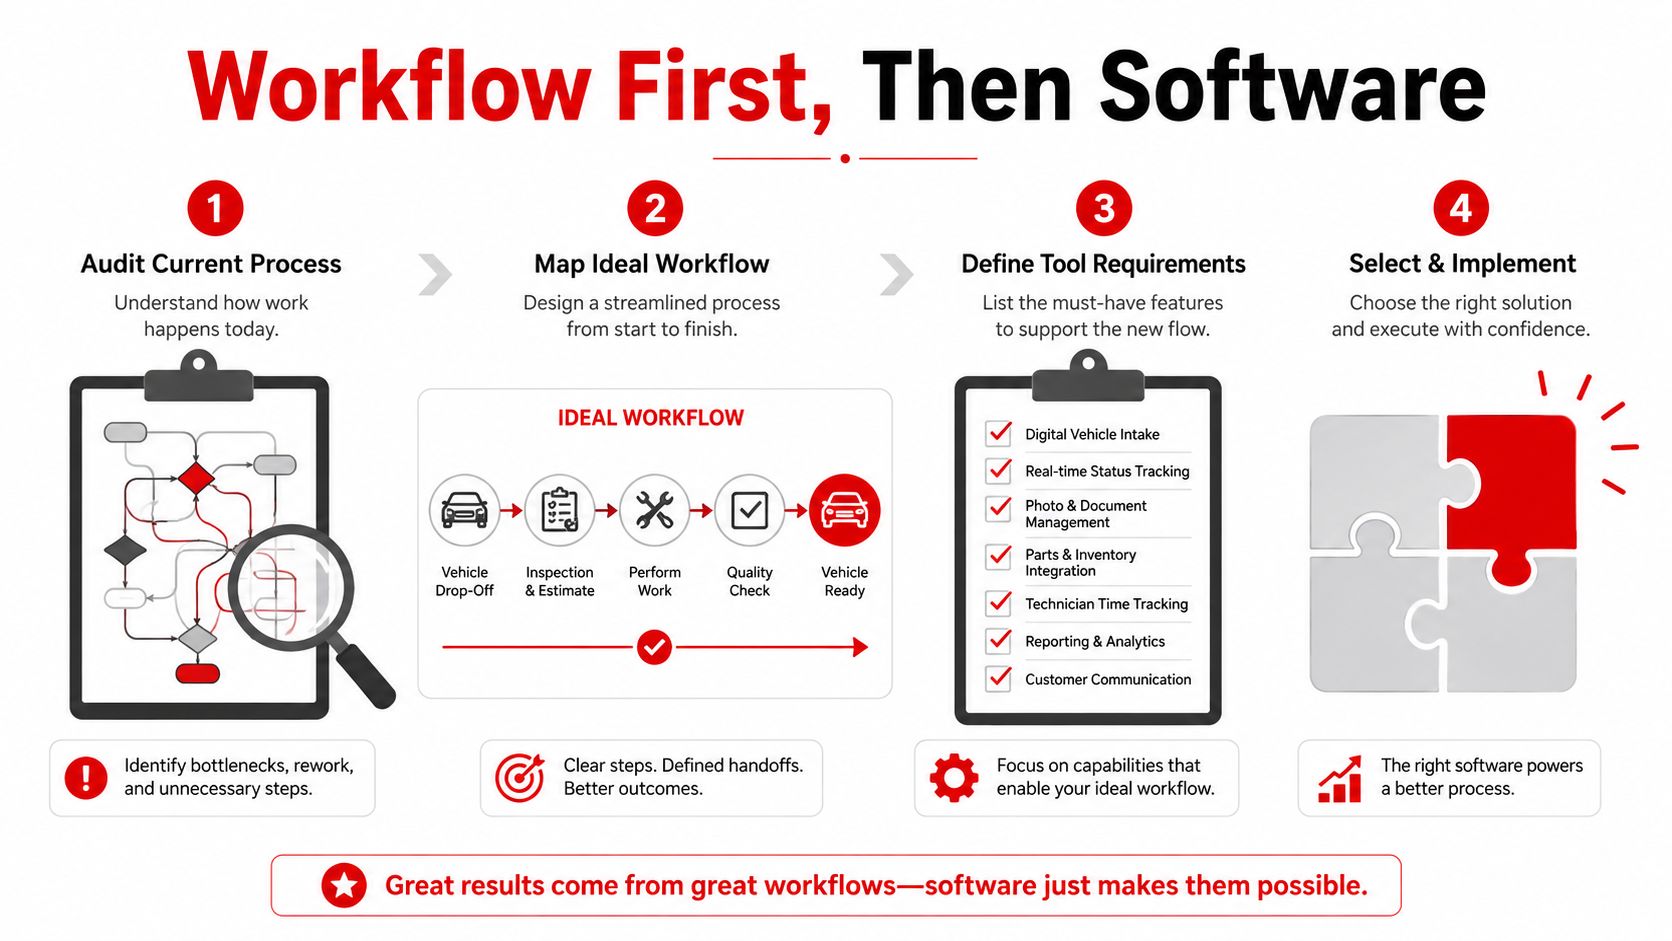
Most shops buy software because the current process feels messy. That usually flips the order. The better move is to redesign the workflow first, then choose tools that match the way the shop should work.
A better flow from drop-off to payment
Start with digital vehicle lookup by plate or VIN. That removes retyping for the advisor and cuts down on bad data that follows the job into estimates and invoices. Move next to photo-rich inspection so the customer sees the issue instead of hearing a vague description over the phone.
Then route parts ordering through live supplier inventory. That gives the advisor better visibility, keeps the technician from waiting on guesswork, and reduces the back-and-forth that breaks the day. A digital shop board should show job priority in real time so no one has to ask which ticket matters most.
After that, use one-click invoicing and online payment so the front desk stops rebuilding the final steps by hand. The customer gets a cleaner closeout, the advisor gets time back, and the manager gets fewer loose ends overall. When each step is visible and standardized, the workflow becomes easier to automate without creating hidden work.
What changes for each role
The advisor retypes less and explains more clearly. The technician gets a better job queue and fewer interruptions. The customer gets faster approval and fewer surprises, which matters because a shop's process is part of the service experience, not just back-office admin.
The rule is blunt. If a step can't be described in one sentence, it is not ready to automate. That rule prevents shops from hard-coding confusion into software and then calling it progress.
RedAppy is one example of software that fits this kind of flow, with a Kanban-style shop board, digital inspections, parts ordering across suppliers, analytics, and customer communications in one place. It belongs in the conversation because it matches the workflow logic, not because software alone solves the problem.
Roll Out Shop Management Software Without Burning the Team
A rollout fails when the team feels like it's being asked to learn a new job on top of the old one. The fix is to stagger change in short, visible wins. That keeps the front desk and the bays moving while the system takes over the repetitive work.
A four-week adoption path that a real shop can use
Week one should turn on digital vehicle history and customer lookup by name, plate, or VIN. That stops the front desk from retyping details and gives the advisor faster context on repeat visits. The same week, the digital shop board should go live so technicians can see the queue in priority order without asking for constant verbal updates.
Week two should shift estimates and approvals to digital, with photo capture attached to the inspection. Parts ordering should move through the platform with live inventory if the shop is ready for it. This is usually the first point where the team feels the difference, because fewer phone calls and fewer manual handoffs show up immediately.
Week three should activate real-time analytics for ARO, technician efficiency, and cycle time. That creates a baseline, which is the only honest starting point for improvement. Without the baseline, the team ends up arguing about impressions instead of facts.
Week four can introduce the AI Repair Assistant for labor times and diagnostic guidance, along with branded customer communications. That order matters because AI is most useful when the workflow is already clean enough to absorb the output. If the process is still messy, the tool just speeds up the mess.
How to keep resistance from spreading
Train the advisor first, then the tech lead, then the rest of the team. The advisor needs to model the new intake path, while the tech lead needs to reinforce the board and the new handoff rules. If someone reverts to paper, the correction should be immediate and calm, because mixed systems create mixed habits.
Most common rollout mistake: treating the software as extra work instead of replacing old work with a clearer process.
The smartest rollout is one that reduces pressure inside the shop while it improves control. A single location can adopt in stages, prove the gain, then expand the pattern across other bays or other stores without forcing everyone through a giant launch day.
Prove ROI in Dollars the Owner Can Actually Show
Efficiency work dies when it stays abstract. Owners need a quick case that ties time saved and work approved to actual money, because that's what a partner, lender, or manager can evaluate without guessing.
Build the case from three numbers
First, count hours reclaimed per week from admin work and parts coordination. Then estimate the ARO lift from faster approvals and cleaner inspections. Finally, look at comeback reduction from better handoffs and clearer job notes. Those are the three levers that make the strongest case because they touch labor, revenue, and rework.
If the shop already knows its labor rate and average ticket, the math stays simple. Reclaimed admin time becomes labor capacity. Better approvals become more sold work. Fewer comebacks mean fewer wasted bays and fewer interruptions for the team.
A single location can often make a convincing case by showing that the front desk stops repeating itself, the board stops losing tickets, and the customer gets to yes faster. Multi-location groups get a second layer of value from shared parts catalogs, consistent SOPs across bays, and one dashboard for managers. The bigger the operation, the more expensive inconsistency becomes.
The cleanest ROI template fits on one page:
- Hours saved: list the weekly admin and coordination time that disappears.
- Revenue lifted: list the extra approved work that closes because the inspection is clearer.
- Quality preserved: list the comeback and rework reduction that protects margin.
- Tool cost: list the subscription or implementation cost in the same frame.
The biggest mistake is comparing tool cost to tool cost only. The comparison should be tool cost versus the hours it gives back and the work it helps capture. A system that feels expensive can still pay for itself if it reduces hidden labor and keeps the workflow moving.
Your Operational Efficiency Checklist and Next Step
A shop owner does not need a giant rollout to find the leak. Start with one job, one bay, or one service lane, then trace it from check-in to checkout and mark every point where work waits, gets entered twice, gets touched again, or forces unnecessary motion.
Use that map to pick three KPIs, technician efficiency, ARO, and cycle time. Those three numbers show whether the shop is getting more value per labor hour, not just moving faster on paper.
Then redesign the workflow before adding another tool. Every step should be describable in one sentence, and if a step needs a long explanation, the process is too messy to hold up under pressure.
Roll out tools in a sequence the team can absorb. Start with lookup, then board visibility, then digital approvals, then analytics and AI support, so the shop can see where each piece helps technician efficiency, protects ARO, or trims cycle time without creating a new pile of training issues.
Prove ROI with hours reclaimed, revenue lifted, and quality preserved. That keeps the owner focused on value per labor hour, which is the metric that matters when the goal is a stronger shop, not just a busier one.
Avoid three failure modes. Do not optimize one bay while breaking another. Do not chase more metrics when fewer will do. Do not treat AI as a feature instead of a workflow partner.
Start by mapping one job from check-in to checkout on a single sheet of paper. Once the stalls are visible, the next decision gets easier, and RedAppy can walk a shop owner through which features line up with those bottlenecks first.
Ready to Transform Your Shop?
RedAppy helps auto repair shops create professional digital estimates with photos and videos, send them instantly via text or email, and get customer approvals in seconds. No credit card required to start.