
Performance Benchmarking for Auto Repair Shops
Your bays are full, the phones keep ringing, and the team feels busy from open to close. Yet the day still ends with questions that gut feel can't answer, like which jobs made money, which ones dragged, and whether the shop is getting better or just staying loud.
That's where performance benchmarking earns its keep. In plain terms, it means comparing current KPIs against a reference point, such as industry standards or best-in-class performance, so a shop can see measurable gaps instead of guessing. Used well, it turns the daily grind into a closed loop of measure, compare, improve, and measure again.
Table of Contents
- Moving Beyond Gut Feel in Your Auto Shop
- The 5 Key Metrics Every Shop Owner Should Track
- How to Reliably Gather and Standardize Your Data
- Setting Performance Targets That Drive Growth
- From Spreadsheets to a Live Performance Dashboard
- Using Your Benchmarks to Make Smarter Decisions
Moving Beyond Gut Feel in Your Auto Shop
A shop can look productive and still leak profit. Bays are occupied, parts are moving, and the crew is flat out, but the owner still doesn't know whether the bottleneck is estimating, scheduling, parts delays, or weak follow-up. That's the trap of managing by instinct, it feels active, but it leaves numbers hidden.
A better shop doesn't need more guessing, it needs a cleaner reference point. The U.S. Bureau of Labor Statistics defines a benchmark as a “standard or point of reference” for comparison, and that idea fits auto repair perfectly when the goal is to compare current work against something meaningful. In a working shop, that reference point can be prior performance, a top-performing peer, or a practical target for throughput, response time, retention, and margin.
Practical rule: if a metric can't be tied to a decision, it's noise, not a benchmark.
That's why the right approach isn't a giant spreadsheet full of vanity numbers. It's a small set of operational signals that tell the truth about how the shop runs, how jobs move, and where money gets left behind. A modern front office can also benefit from workflow tools that keep those numbers visible, including when the service desk needs help managing calls, follow-up, and customer communication.
The shift happens when the owner stops asking, “Are we busy?” and starts asking, “Are we efficient, and can we prove it?” That's the moment benchmarking stops being theory and starts becoming shop control.
The 5 Key Metrics Every Shop Owner Should Track
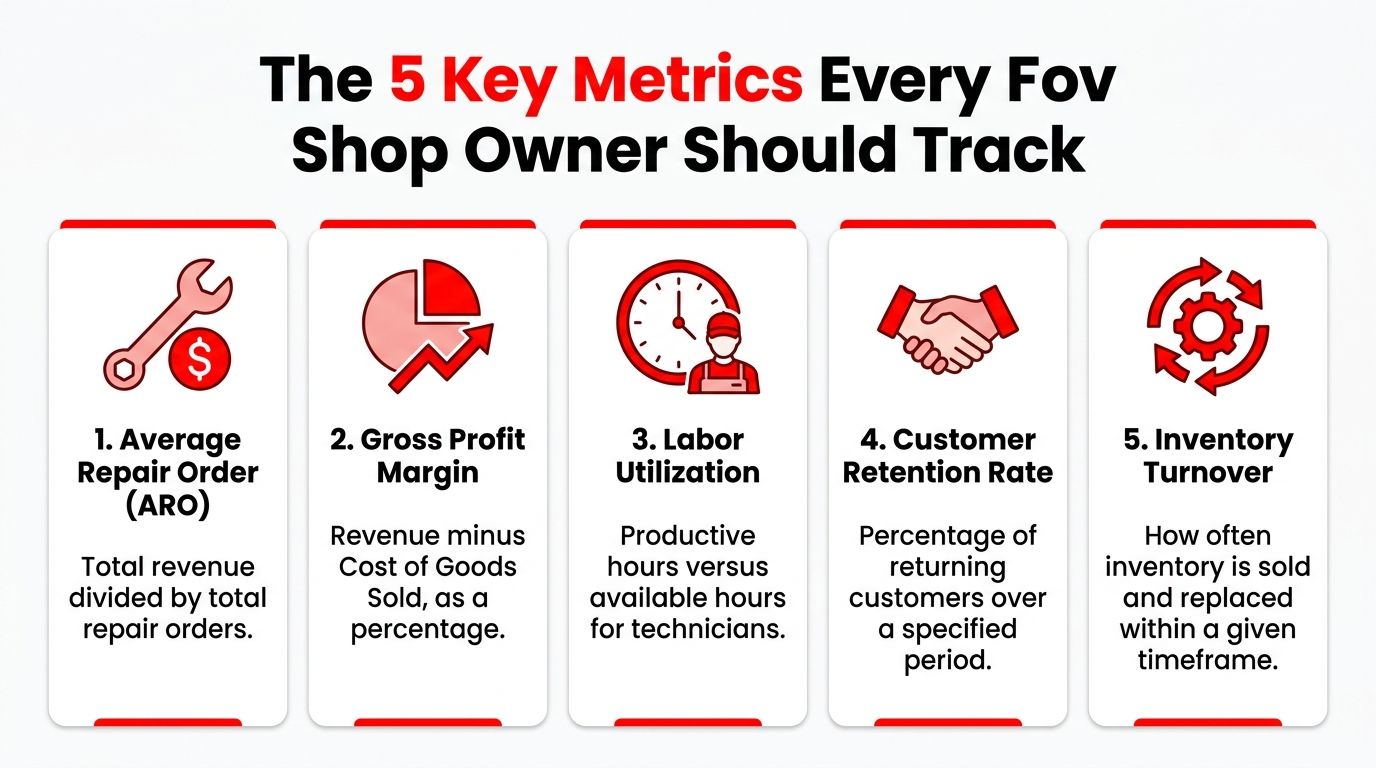
The right dashboard doesn't bury a shop in metrics. It narrows attention to the few figures that explain whether the business is converting labor, parts, and customer trust into profit.
Technician Efficiency
This tells the owner how much of a technician's available time is producing billed work. If the number is weak, the shop usually has a scheduling problem, a parts staging problem, or too much waiting between approval and repair. A good way to calculate it is productive billed hours divided by available hours.
Average Repair Order
ARO shows how much revenue each repair order brings in on average. The simple formula is total repair order revenue divided by the number of repair orders. When ARO is drifting down, the shop may be discounting too often, missing maintenance opportunities, or writing tickets that are too small to support the overhead.
Repair Order Cycle Time
This tracks how long a vehicle stays in the shop from check-in to completion. It matters because slow cycle time ties up bays, frustrates customers, and creates a backlog that looks like demand but behaves like congestion. Shops should define this the same way every time so the number doesn't bounce around just because different people are measuring it differently.
Repeat Business Rate
This measures how many customers come back instead of shopping elsewhere. The exact calculation can vary by shop, but the concept stays the same, returning customers divided by total customers over a set period. A healthy repeat pattern usually tells the owner that service quality, trust, and follow-up are working together.
Gross Profit on Parts and Labor
This is the margin picture that keeps the whole business honest. It shows whether the shop is making enough after direct costs are paid. A shop can post strong sales and still struggle if parts pricing, labor capture, or discounting is out of line.
Performance benchmarking works because it compares current KPIs against a reference point, not because it chases a single magic number. Modern frameworks regularly track revenue, profit margin, customer satisfaction, time-to-market, cost per unit, and retention, which is why the best shop scorecards look like a system rather than a single gauge.
Useful shop habit: keep the KPI set small enough that the service manager can explain it without opening a binder.
How to Reliably Gather and Standardize Your Data
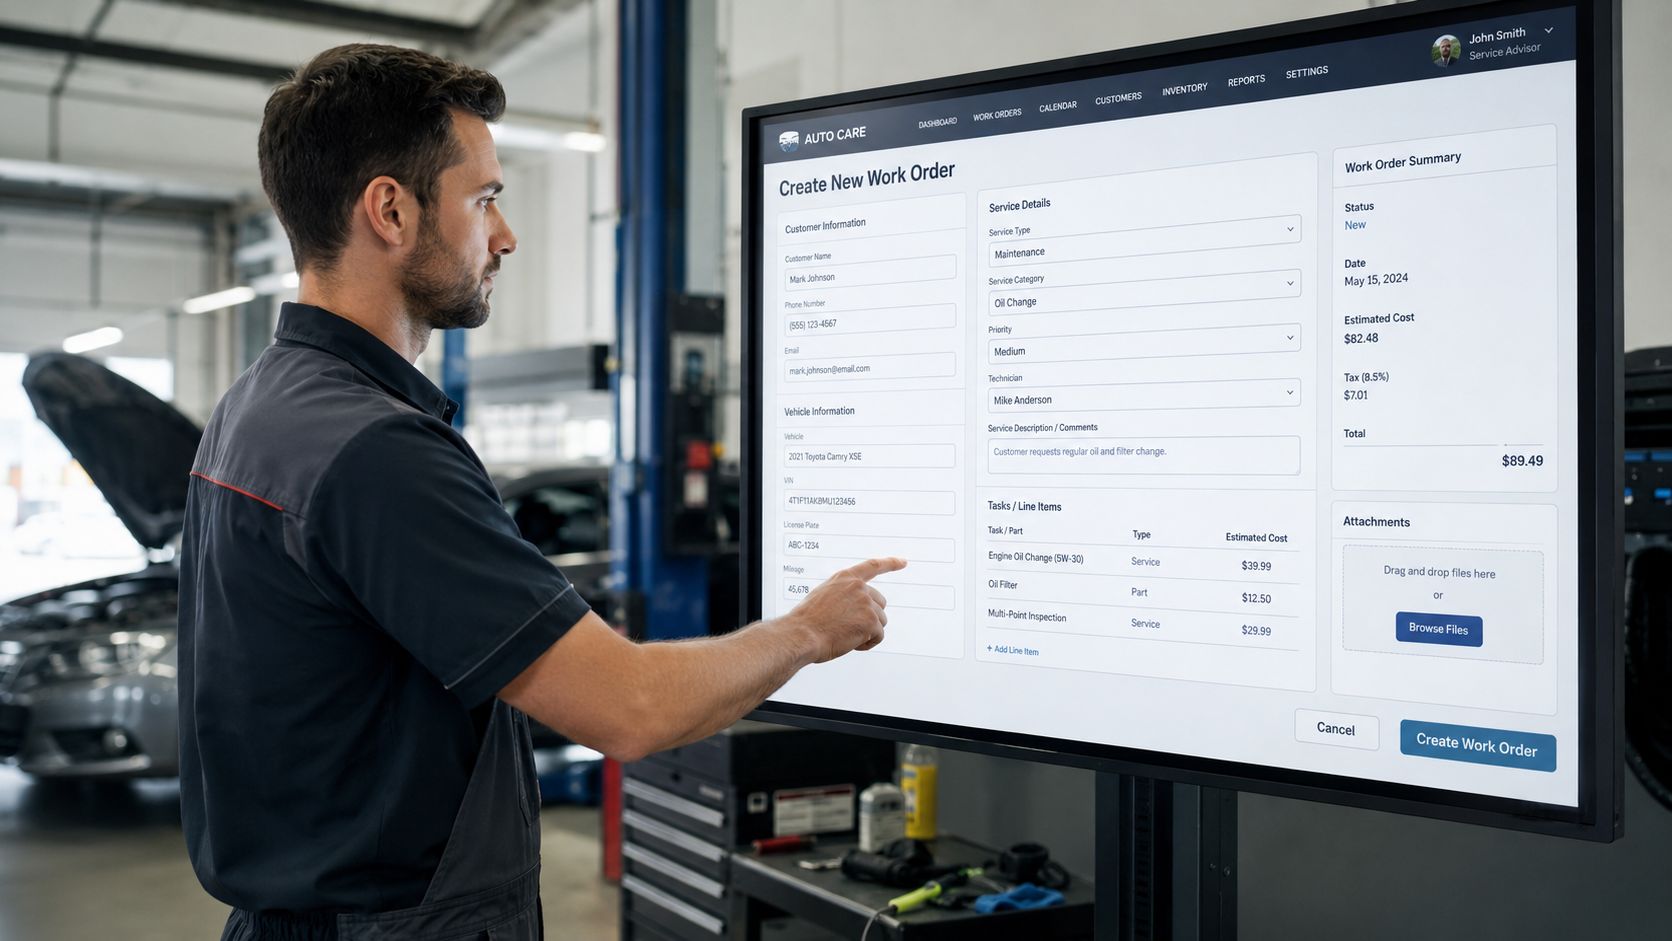
Data only helps when the shop collects it the same way every time. If one advisor logs cycle time at estimate approval and another logs it at parts arrival, the dashboard turns into a fight over definitions instead of a management tool.
Build the same numbers from the same sources
A shop's strongest source is its own management system, because it already captures the work order flow, approvals, labor, and customer history as the job moves through the lane. Accounting software adds the financial layer, and even simple manual logs can work for a smaller operation that's just getting started. The point is not fancy software, it's getting reliable inputs into one place.
The best workflow is closed loop: define scope, select multiple metrics, identify comparison targets, collect data, analyze gaps, set improvement targets, implement changes, then re-benchmark on a regular cadence. For operational metrics, that cadence is typically monthly or quarterly, because the shop needs enough activity to show a pattern without waiting so long that small issues become expensive habits.
Normalize before comparing
Normalization means measuring things the same way every time. Cycle time should mean the same start point and finish point from one report to the next. Technician efficiency should use the same definition of available hours and productive hours every time. Without that discipline, the owner isn't benchmarking performance, only comparing mismatched snapshots.
Shop-floor truth: bad definitions create fake problems, and fake problems waste real labor.
RedAppy fits naturally here as one option for shops that want the numbers captured in the same system that handles jobs, inspections, invoicing, and analytics. Other shops may start with spreadsheets, but the key is making sure every update comes from a consistent process instead of someone rebuilding the report by hand.
A clean data trail makes the next decision easier. When the numbers are standardized, the owner can trust the trend lines, and the service team can act on them without second-guessing the report.
Setting Performance Targets That Drive Growth
Benchmarks work best when they point to a target the team can hit. A shop that sets goals too high ends up demoralizing the front counter and the bays, while a shop that sets goals too low only teaches everyone to accept stale performance.
Start with internal history
The first benchmark should come from the shop itself. Compare current performance with prior periods, then look for patterns in the numbers that repeat under similar workload conditions. That internal baseline tells the owner what the shop can already do when the process is steady and the team is in rhythm.
Once that baseline is clear, external comparison adds context. Industry references and best-in-class performance show whether the shop is merely improving or closing a meaningful gap. The mistake is using outside data as a hammer, because a peer group that doesn't match the shop's size, location, or service mix can push the wrong behavior.
Set targets the crew can believe
Targets should be incremental and visible. A better target is one the advisor can explain to a technician without debate, because everyone understands what changes in the bay will move the number. Monthly or quarterly operational benchmarking makes that kind of course correction easier, since the shop can adjust before bad habits settle in.
A practical target structure looks like this:
- Internal baseline first: use the shop's own recent trend as the starting line.
- External context second: compare only to relevant peers, not every business in sight.
- Small moves, not fantasies: focus on one manageable improvement at a time.
- Owner and team alignment: make sure the front office and the shop floor know what action moves the metric.
The goal is not to win a dashboard contest. It's to make the shop a little sharper each cycle, then let those small gains compound into stronger profitability and less chaos at the counter.
From Spreadsheets to a Live Performance Dashboard
Spreadsheets can work for a while, but they're slow, fragile, and easy to ignore once the day gets busy. By the time a manager updates the file, yesterday's issue may already have turned into today's backlog.
Put the numbers where the team already looks
A live dashboard wins because it collapses the delay between action and feedback. If the owner can see ARO, technician efficiency, and car count in one view, the shop doesn't have to wait for a weekly report to notice a problem. That makes the dashboard useful in the same way a lift is useful, it's there when the job needs to move.
A proper dashboard should show trend lines, not just raw totals. It should separate sales from capacity, because a shop can be busy and still underperform if the jobs are low value or the cycle is too slow. It should also be simple enough that a service advisor can glance at it between customers and understand what changed.
Use the dashboard to shorten the feedback loop
The advantage is speed. A live display lets the owner see when a pattern changes, then act before the month is over. That's much better than waiting for a spreadsheet review after the number has already been absorbed into payroll, parts orders, and customer dissatisfaction.
Good dashboard design always answers the same three questions: what changed, where it changed, and who needs to act.
A platform like RedAppy can put analytics, job flow, and shop activity in one operational view, which is useful when the owner wants the performance data tied to the same system that runs the front office and the shop floor. The right dashboard doesn't replace judgment, but it does remove the delay that usually keeps judgment too far behind the work.
When the numbers are live, the shop stops managing by memory. The team can see the work, see the trend, and make the next decision while there's still time to change the outcome.
Using Your Benchmarks to Make Smarter Decisions
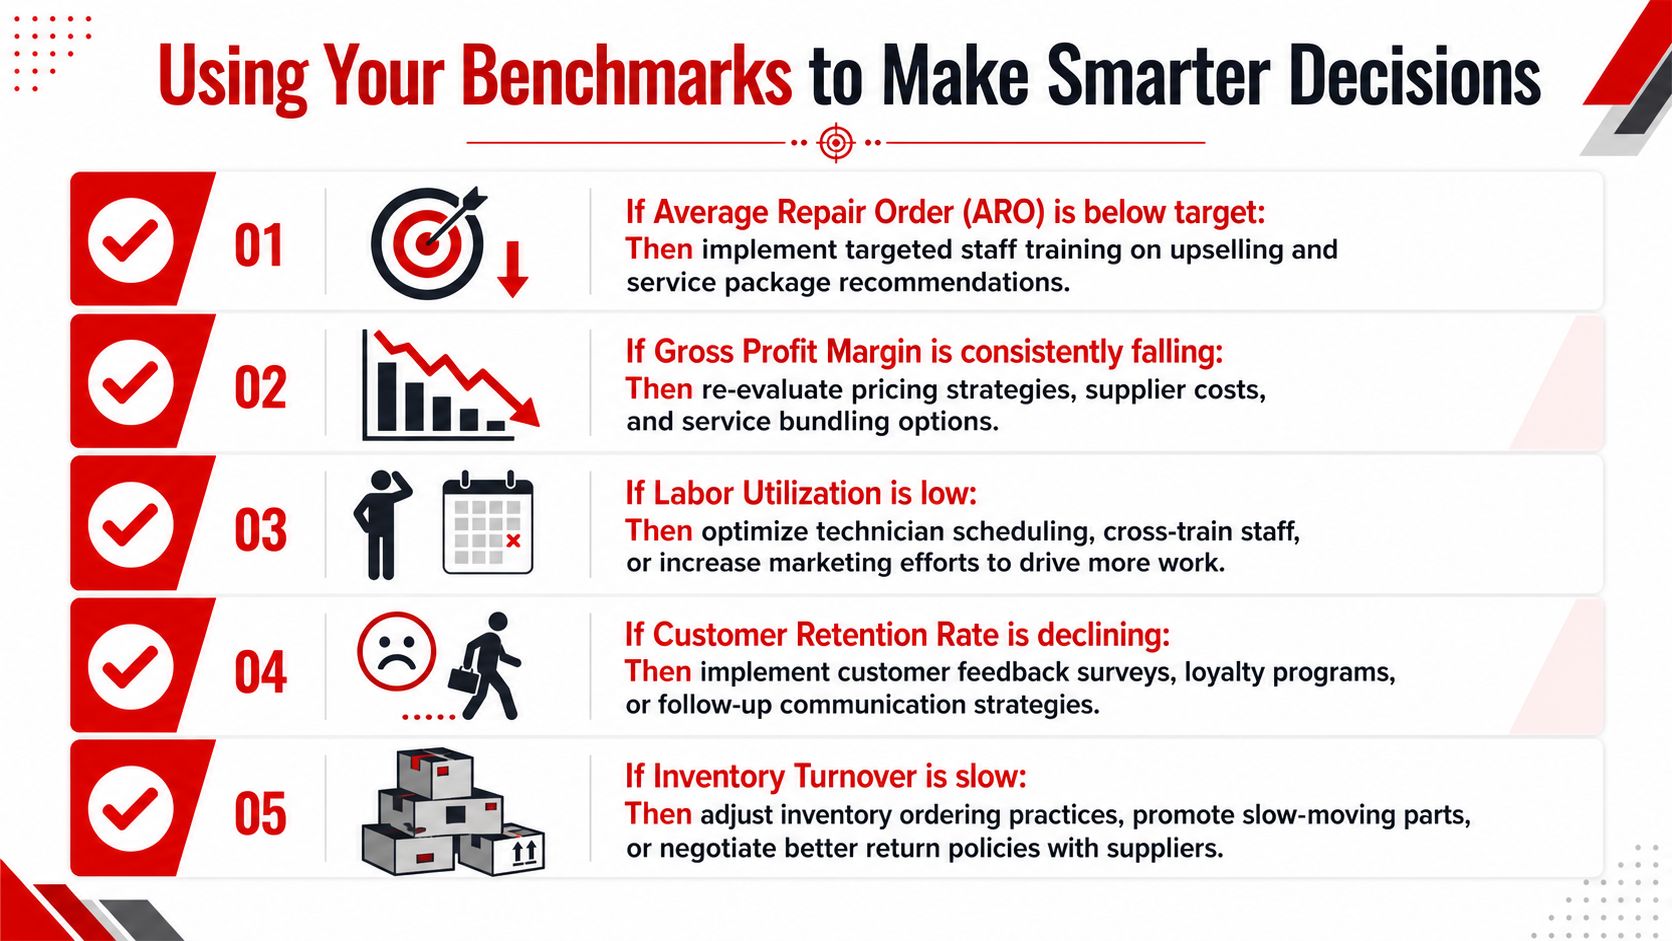
Benchmarking only matters when the owner uses it to change something in the shop. If the numbers stay on a screen and never affect staffing, pricing, follow-up, or parts handling, then the whole exercise becomes decoration.
Turn each weak metric into a specific response
If Average Repair Order is below target, the first move is usually not a blanket discount. It's more useful to tighten advisor training, review service package presentation, and check whether recommendations are being explained clearly enough for the customer to say yes.
If Gross Profit Margin is slipping, the shop should look at pricing discipline, supplier costs, and how often jobs are being bundled or discounted. Margin problems often hide inside habits that feel harmless on a single ticket but become expensive across a full month.
If Labor Utilization is low, the owner should inspect scheduling, dispatching, and the flow of work into the bays. A slow week can be a marketing problem, but it can also be an internal coordination problem that looks like weak demand from the outside.
If Customer Retention Rate is declining, recent service follow-up deserves attention. The shop may need better reminders, clearer communication, or a more reliable handoff from the front desk to the technician and back again.
If Inventory Turnover is sluggish, the parts process needs a reset. Slow-moving stock ties up cash and clutters the floor, so ordering habits, return policies, and purchasing discipline all need a hard look.
For a practical way to connect these fixes back to financial results, a can help the owner tie actions to outcomes without losing sight of the math.
Keep the loop running
A benchmark is not a trophy, it's a prompt. The shop compares the current result, makes a change, and then checks whether the next cycle moved in the right direction. That closed loop is what turns measurement into management.
A common mistake is watching easy operational metrics while missing whether those numbers drive effectiveness, or picking the wrong peer group and treating benchmarking like a one-time comparison. The better habit is to keep the goals explicit, the peers relevant, and the cadence steady.
If the shop wants that discipline built into one operating system, RedAppy brings analytics, job flow, and customer history into the same place the team already works. Visit RedAppy to see how a live dashboard can keep your benchmarks visible, your decisions faster, and your shop easier to run.
Ready to Transform Your Shop?
RedAppy helps auto repair shops create professional digital estimates with photos and videos, send them instantly via text or email, and get customer approvals in seconds. No credit card required to start.