
Repeat Customer Rate Explained for Auto Shops
A brake-job customer rolls out of the bay, pays promptly, and never calls again. In the next lane, a family brings in three vehicles, approves maintenance because the advisor explains it clearly, and returns whenever a warning light appears. Both visits create revenue today, but only one relationship helps keep tomorrow's schedule dependable.
That difference is what the repeat customer rate reveals. For an auto repair shop, it's more than a marketing figure. It shows whether customers trust the team enough to return, whether service reminders reach the right people, and whether future work can support steady bay and technician utilization.

This guide makes the metric practical. It explains the definition, separates repeat customer rate from customer retention rate, walks through the formulas, compares realistic benchmarks, and shows how shops can track the number by cohort, vehicle, and service category. It also connects repeat visits to service-lane retention, lifetime value, and the workflow tools that help a shop turn one-time repairs into ongoing relationships.
Short sections, plain examples, and auto shop analogies keep the subject usable. The point isn't to chase a generic benchmark. It's to understand whether the shop's own customers are coming back, why they return, and where the workflow loses them.
Table of Contents
- Introduction Why Repeat Business Keeps Your Bays Full
- What Repeat Customer Rate Really Means for Auto Repair
- How to Calculate Repeat Customer Rate With Formulas and Examples
- Auto Repair Benchmarks and What Good Looks Like
- Why Repeat Customer Rate Drives Revenue and Growth
- How to Track Repeat Business and Set Your Reporting Cadence
- Proven Strategies to Improve Repeat Customer Rate With RedAppy
Introduction Why Repeat Business Keeps Your Bays Full
A shop can have a busy week and still have an unstable business. A burst of brake repairs, diagnostic work, or tire sales may fill the schedule temporarily, but one-time customers leave the shop dependent on constant replacement traffic. That creates pressure on advertising, front-desk follow-up, and technician scheduling.
Repeat customers change the pattern. A customer who returns for an oil service, follows up on a recommended repair, or brings in another household vehicle gives the shop a known relationship to maintain. The team already has vehicle history, communication preferences, and a record of past work. The next visit starts with context instead of a blank repair order.
Practical rule: A full schedule tells a shop what happened. Repeat customer rate helps explain what may happen next.
The metric works like a health check for customer continuity. A rising rate can indicate that inspections are clear, estimates are understandable, repairs meet expectations, and reminders are reaching customers at useful times. A weak rate can point to missed follow-ups, unclear recommendations, inconsistent communication, or a service experience that didn't earn another visit.
Auto repair also requires more careful measurement than a simple store purchase. Vehicle needs vary, repair intervals vary, and a customer may own more than one vehicle. A customer who hasn't returned for a specific service may still be active with another vehicle or service category. That's why a shop should examine repeat behavior by customer cohort, vehicle, service type, and location rather than relying on one blended number.
This guide provides a practical framework:
- Definition: What the rate measures and what it leaves out.
- Calculation: How to use the repeat customer formula and the separate retention formula.
- Benchmarks: Why retail comparisons can mislead auto repair operators.
- Business impact: How return visits support revenue stability, lifetime value, and bay planning.
- Action plan: How tracking, follow-up, inspections, and workflow tools can improve repeat business.
What Repeat Customer Rate Really Means for Auto Repair
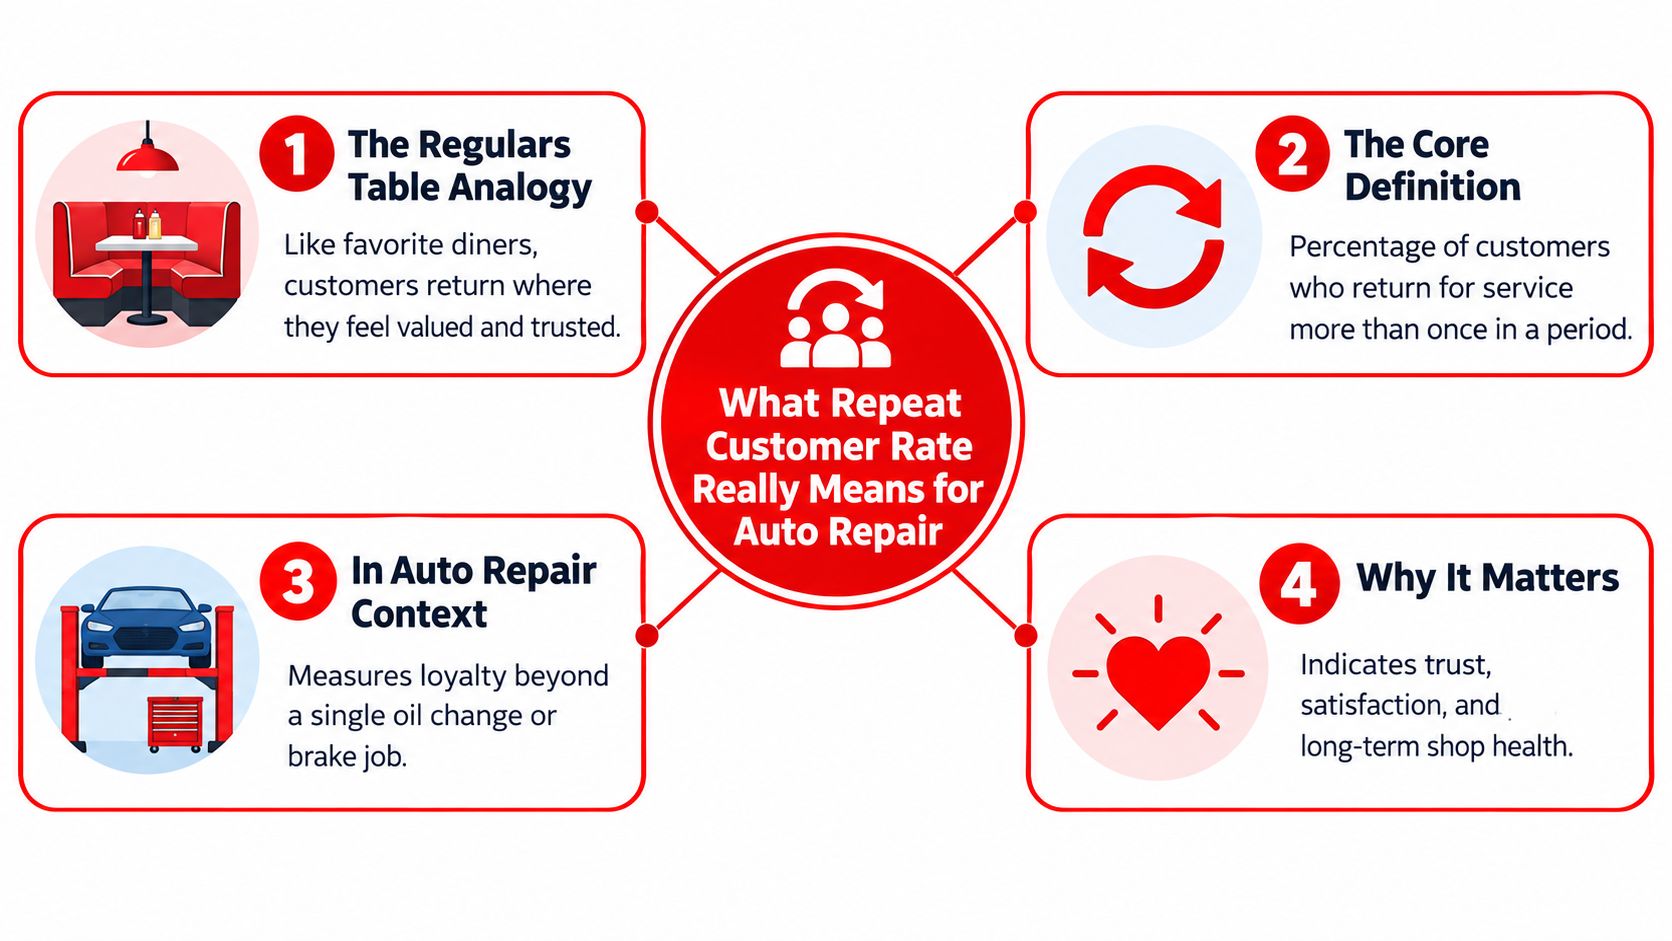
A customer leaves after a brake repair. Months later, the same driver returns for maintenance, diagnostics, or another repair. That second completed visit is the behavior this metric captures. In an auto shop, it connects customer continuity with service-lane retention and future bay use.
Repeat customer rate is the percentage of customers who buy more than once during a defined period.
For auto repair, “buy more than once” means completing more than one paid service visit within the measurement window. The visits might cover maintenance, inspections, diagnostics, brake work, or another repair. The rate therefore shows whether a shop is bringing customers back after the first oil change or urgent repair.
Repeat customer rate versus retention rate
The two measures answer different operational questions.
Repeat customer rate asks, “What share of customers purchased more than once?” It counts repeat transactions during a chosen period. A customer can qualify after visits close together, such as a diagnostic appointment followed by an approved repair.
Customer retention rate asks, “What share of the starting customer base did the business keep through the period?” It considers customers present at the beginning, new customers added during the period, and customers still active at the end. The plain-language guide to helps separate this period-based view from repeat purchasing.
A shop can use both measures, but they support different decisions. Repeat customer rate helps evaluate whether completed work leads to another visit. Retention rate helps assess whether the service lane is keeping its customer base over time.
Returning-customer percentages tend to be higher for services and subscriptions than for transactional retail because service relationships create ongoing needs. Auto repair has recurring maintenance needs, yet the interval varies with vehicle use, age, mileage, and repair urgency. A returning customer may need another visit soon, or may remain active only after a longer service interval.
The denominator sets the boundary of the analysis. Define the period, decide whether the shop counts a household or a vehicle owner, and apply that rule consistently. A Digital Shop Board and RedAppy analytics can then connect returning customers with completed work, service categories, and available bay capacity. Without a consistent definition, a short-term repeat-purchase result can be mistaken for a longer-term retention result.
How to Calculate Repeat Customer Rate With Formulas and Examples
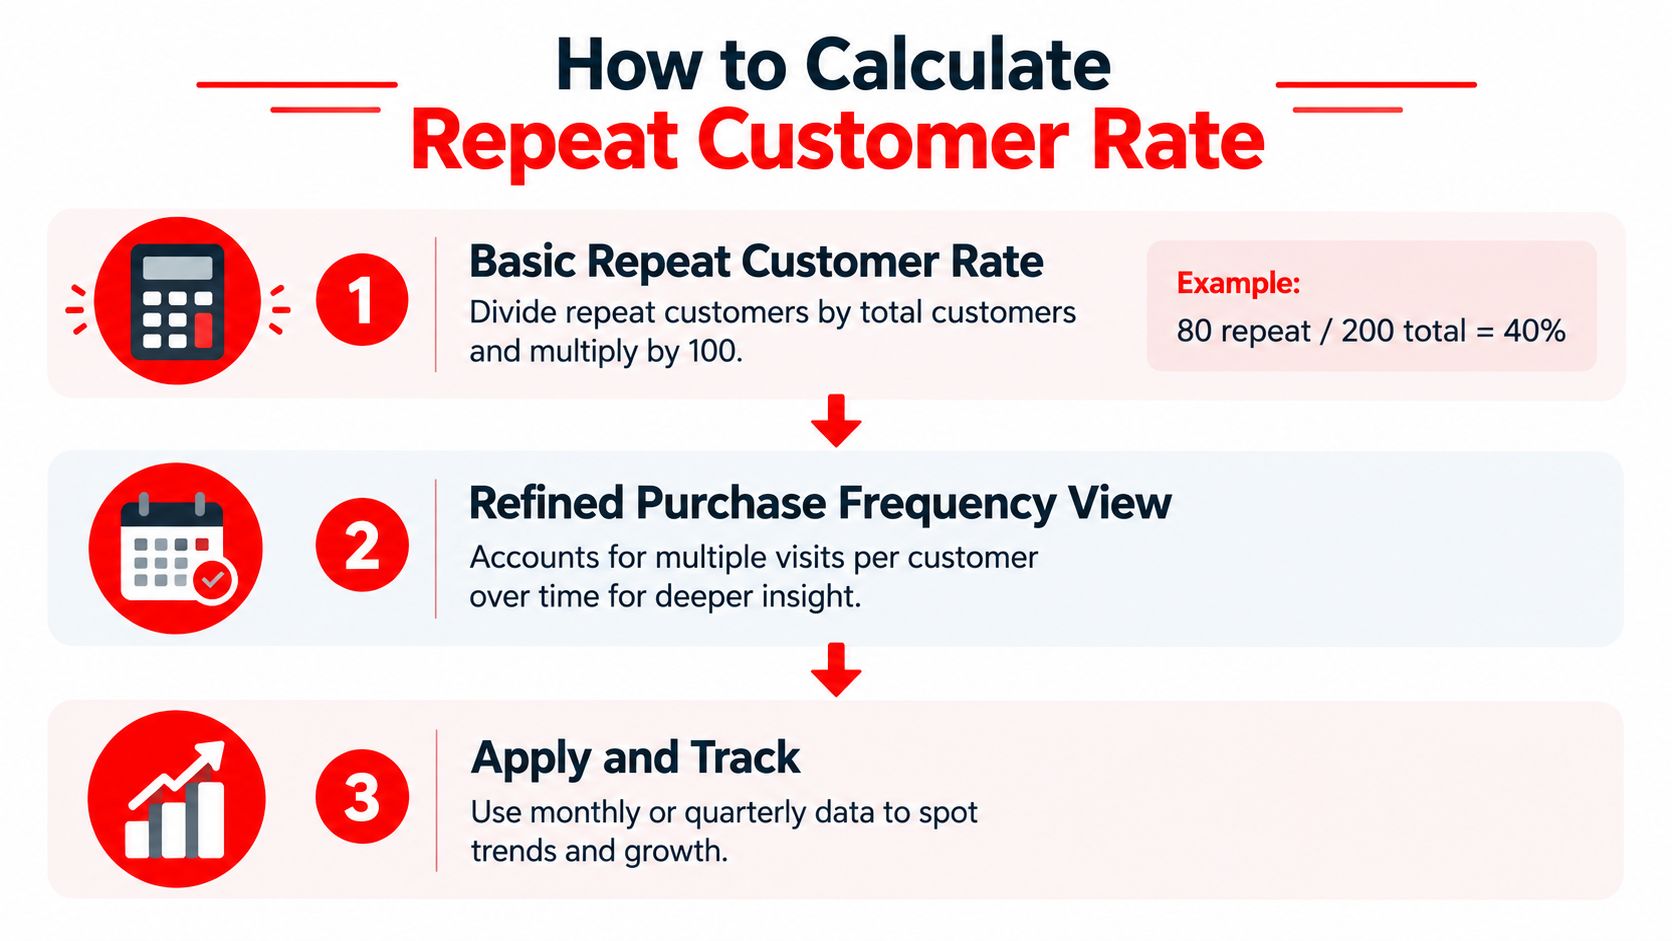
A service lane has a simple question after the work is complete: how many customers came back for another visit during the same measurement period? The answer starts with two counts:
Repeat customer rate = repeat customers ÷ total customers × 100
Count each unique customer once in the total. Then identify customers who completed more than one purchase or service during the defined period. The standard formula and example are documented by.
For an auto shop, treat the calculation like checking a repair order before closing it. Set the rules first, then apply them consistently:
- Choose the window. Use a defined month, quarter, or other period.
- Count unique customers. Remove duplicate repair orders from the total.
- Count repeat customers. Include customers with more than one completed purchase or service.
- Divide and multiply. Use the same denominator throughout the calculation.
A standard example uses 300 repeat buyers out of 1,000 customers, producing a 30% repeat customer rate. In a shop, that could mean 300 unique customers returned for another completed service among 1,000 unique customers measured during the period.
The retention formula answers a different question
Customer retention rate uses a period-based formula:
Retention rate = ((customers at end of period − new customers acquired during the period) ÷ customers at start of period) × 100
documents this method. It removes newly acquired customers from the ending total, leaving the portion retained from the starting customer base.
Suppose a shop reviews a quarterly cohort. The team starts with a known customer group, removes newly acquired customers from the ending group, and compares the remainder with the starting group. That result shows whether the existing base stayed active. It does not show whether those customers made a second purchase.
Avoid denominator mistakes
Small recordkeeping errors can distort bay-planning decisions and make service-lane performance look stronger or weaker than it is:
- Mixing unique customers with repair orders: Several invoices for one customer should not inflate the customer count.
- Changing the window: Label monthly and quarterly results separately before comparing them.
- Counting scheduled work as repeat business: Count completed service, not only an appointment.
- Ignoring customer identity quality: Different spellings, phone numbers, or vehicle records can split one customer into several profiles.
- Blending vehicles without a rule: A household returning with another vehicle may show customer loyalty, even if the first vehicle remains inactive.
A shop can calculate the rate manually, but consistent records make the result repeatable. RedAppy analytics and the Digital Shop Board can help connect completed work with returning customers and bay activity. The number becomes useful when the shop applies the same logic each time.
Auto Repair Benchmarks and What Good Looks Like
A shop can see a strong repeat customer rate in a report and still have underused bays. The meaning depends on the customer group, service window, and type of work being measured. Retail benchmarks offer context, but they are not an auto repair scorecard.
One independent benchmark roundup reports an average ecommerce repeat purchase rate of 28.2%, meaning roughly 7 in 10 first-time buyers don't return. Grocery and food delivery can reach 65.2%, while luxury goods may be as low as 9.9%. Those differences show how strongly purchase cycles shape the metric.
Auto repair has a different rhythm. Customers may return for maintenance, inspections, diagnostics, and repairs throughout a vehicle's usable life, but the next visit depends on mileage, vehicle condition, and the service completed. A shop should compare its results with similar service behavior and with its own historical cohorts.
Service and subscription businesses often show higher returning-customer percentages than ecommerce and retail, according to Focus Digital's returning-customer benchmarks. The definitions are not identical, so those figures should not become an auto repair target. They can still prompt a useful question: did customers stop returning after a particular service, advisor interaction, or follow-up gap?
Retail retention varies by category
The following table uses retail benchmarks reported across seven retail verticals by. These figures provide context, not a score for the service lane.
| Vertical | Average retention or repeat rate | Implication for auto shops |
|---|---|---|
| Jewelry and accessories | 19.1% | Long replacement cycles can limit repeat buying, unlike routine vehicle service. |
| Footwear | 22.2% | Product need and purchase timing differ from maintenance schedules. |
| Apparel | 31.7% | More frequent purchases can create more natural return opportunities. |
| Department stores | 36.2% | Broad product ranges can encourage repeat visits across categories. |
| Health and beauty | 41.2% | Consumable and replenishment behavior can resemble recurring service more closely. |
The same Shopify summary also reports retail retention around 63%. A shop should record its formula, reporting period, customer definition, and service categories beside every result. Otherwise, a change in the number may reflect a changed method rather than changed customer behavior.
A realistic interpretation
Consumables such as cosmetics and food and beverage often see 30% to 40% repeat customer rates. Fashion and apparel commonly reach 25% to 35%, while electronics and other long-lifecycle products can be strong at 10% to 20%. Auto repair has more natural opportunities for repeat contact than many durable-product categories, yet the timing of the next visit remains vehicle-dependent.
Use the benchmark as a diagnostic reference. A rising rate among maintenance customers, a decline after diagnostic visits, or a gap between locations can show where service-lane retention needs attention. RedAppy's Digital Shop Board and analytics can help connect those patterns with bay utilization, completed work, and the customer groups producing each result.
Why Repeat Customer Rate Drives Revenue and Growth
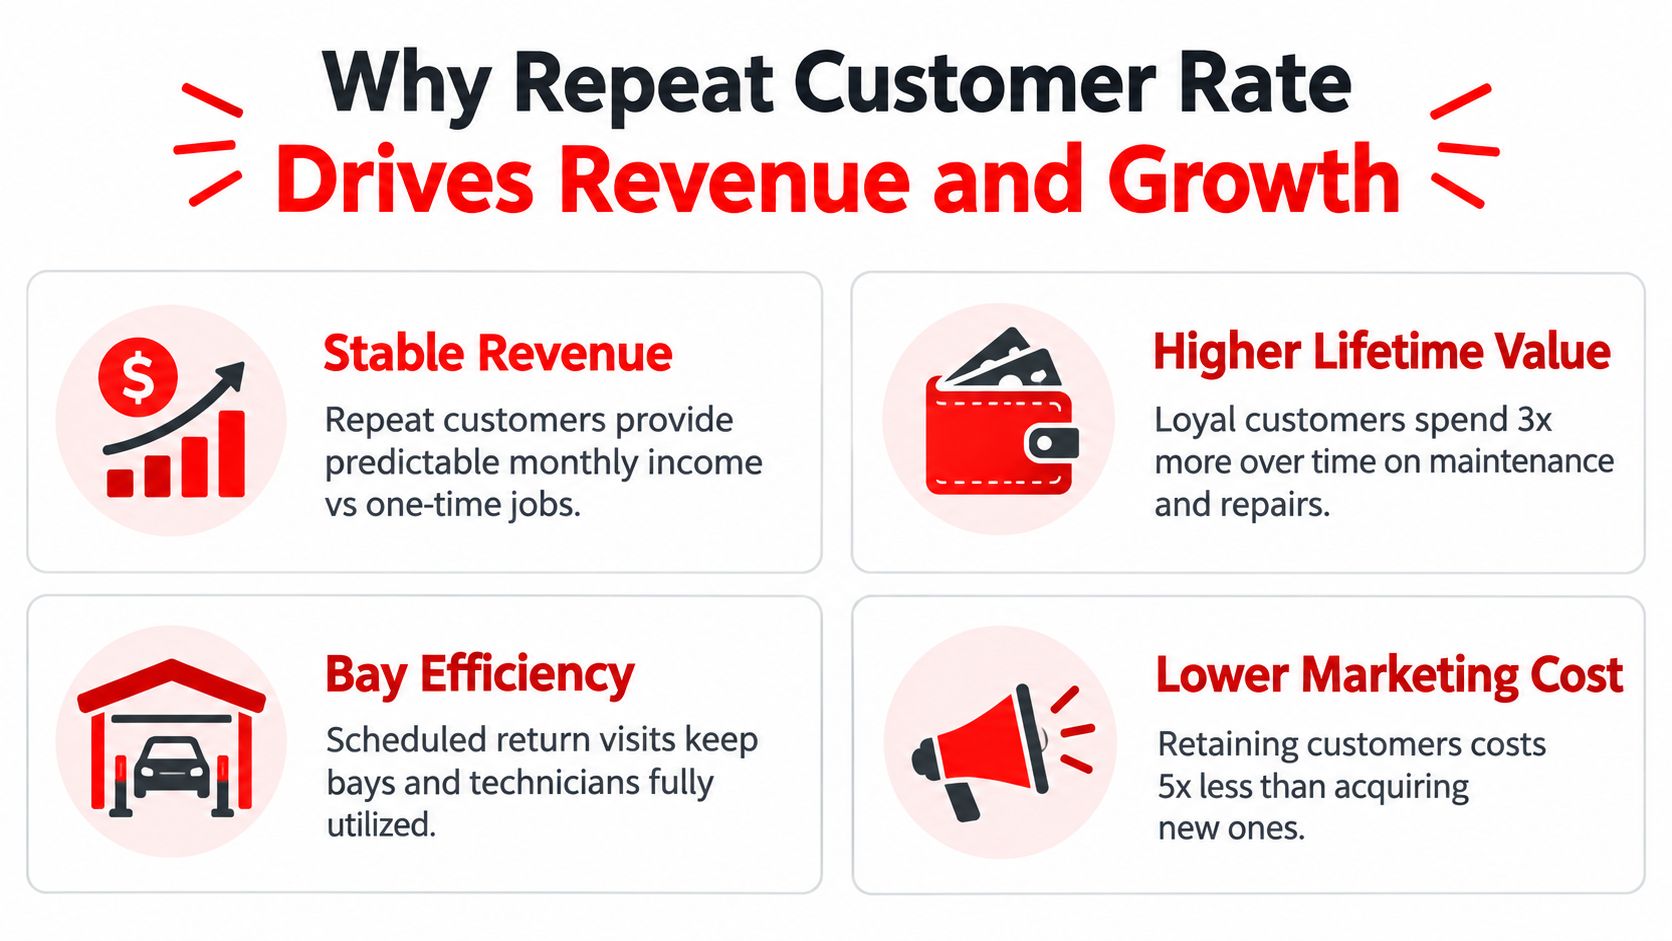
Repeat customer rate matters because the percentage represents future operating behavior. A customer who returns creates another repair opportunity without requiring the shop to rebuild trust from the beginning. The team can review prior work, understand the vehicle, and plan communication around known needs.
That continuity supports several operational outcomes:
- Revenue stability: A returning customer base can make future demand more predictable than a schedule filled entirely with first-time jobs.
- Bay utilization: Planned maintenance and follow-up repairs give managers more visibility into upcoming work.
- Technician efficiency: Vehicle history and prior inspection findings reduce repeated discovery work.
- Lifetime value: A customer who uses the shop across multiple service visits can contribute value beyond the first repair order.
- Acquisition efficiency: Existing customers already know the shop, so the business can spend less effort introducing its process from scratch.
A fixed-operations automotive study found that 74% of buyers who returned to a dealership for service in the past 12 months said they were likely to repurchase from that same dealership. For independent repair shops, the broader lesson is direct. The service lane can influence future vehicle relationships, not only immediate repair revenue.
A shop-floor example
Shop A fills its calendar with new callers but rarely follows up after an inspection. Advisors spend time explaining the same intake process, technicians have limited vehicle history, and the manager reacts to empty bays rather than planning around known customers.
Shop B records declined work, sends useful maintenance reminders, documents inspections with photos, and makes approvals easy. Its returning customers create more scheduled opportunities, and advisors can personalize conversations around previous repairs. The difference isn't just a higher percentage on a dashboard. It's a workflow that gives the team more chances to serve customers who already understand the shop's value.
Repeat rate should sit beside other KPIs. Average repair order shows the value of each completed visit. Visit frequency shows how often customers return. Customer lifetime value estimates the relationship's total contribution. A practical resource on can help operators connect customer behavior with longer-term value without treating one metric as a complete financial picture.
How to Track Repeat Business and Set Your Reporting Cadence
A useful tracking system begins with clean identity data. The front desk should be able to locate a customer by name, license plate, or VIN, then see the vehicle's service history, prior recommendations, completed repairs, and visit dates. That record helps the team distinguish an inactive customer from a customer whose activity was split across duplicate profiles.
Service category matters too. A customer may repeat maintenance but not diagnostics, or return for tires while sending major repairs elsewhere. Reporting by category can reveal which experiences create loyalty and which ones lose customers after the first visit.
The weekly shop-floor check
Each week, the manager or service advisor can review:
- Recent first visits: Identify customers who completed an initial service but have no future appointment or follow-up.
- Declined recommendations: Check whether customers received a clear estimate and whether the team scheduled a later conversation.
- Missed appointments: Contact customers who didn't arrive, using a helpful tone rather than a generic sales message.
- Open repair orders: Confirm that completed work, payments, and customer records are fully closed.
A Digital Shop Board makes this review easier when it shows jobs moving from check-in through inspection, approval, repair, and checkout. The board should support action, not just display status. A customer who leaves with deferred maintenance should become a follow-up task, not disappear after payment.
Monthly and quarterly views
A monthly cohort report groups customers by their first completed visit and checks whether they returned. This helps separate a recent acquisition issue from an older service-experience problem. It also lets managers compare service categories, advisors, technicians, and locations using the same measurement rule.
A quarterly review can examine broader patterns:
- Repeat customer rate by cohort
- Retention rate for the existing customer base
- Average repair order by returning status
- Visit frequency and time between visits
- Customer lifetime value by service category
RedAppy's workflow can centralize customer lookup, vehicle history, scheduling, job status, and analytics in one operating view. Consistency is more valuable than a complicated dashboard. A report that the team reviews every week can support better decisions than a detailed report nobody opens.
Proven Strategies to Improve Repeat Customer Rate With RedAppy
Repeat business grows when the first visit feels organized, transparent, and easy to continue. The most effective tactics connect customer trust with follow-up discipline.
Start with proof. Photo-rich digital inspections show customers what the technician found instead of asking them to approve an unexplained repair. A clear estimate gives the advisor a practical way to discuss priority, timing, and deferred work.
Remove payment friction. Instant estimates, one-click invoicing, and online payments shorten the path from approval to completion. Customers are more likely to remember a smooth process than a repair experience filled with calls, paperwork, and uncertainty.
Use the vehicle history. A reminder becomes more useful when it refers to the actual vehicle and previous service. Customer records organized by name, plate, or VIN help advisors avoid generic messages and recognize the customer's maintenance pattern.
Follow up consistently. Automated reminders can prompt maintenance, deferred work, and post-service contact. The message should help the customer make a decision, not ask for another appointment.
Find the drop-off point. Analytics can show whether customers stop returning after a particular service category, advisor interaction, or location. The AI Repair Assistant can support technicians and advisors with repair guidance and shop insights, while the Digital Shop Board helps managers see whether unfinished workflow steps affect communication.
Stay available between visits. A branded website with contact forms gives customers a simple way to ask questions or request service when the shop is closed. That presence keeps the relationship connected to the shop rather than to a competitor's search result.
A platform such as RedAppy combines digital inspections, estimates, invoicing, online payments, vehicle history, scheduling, analytics, a Digital Shop Board, and an AI Repair Assistant for auto repair workflows. Shops should evaluate any system against their own process, then measure whether better follow-up and clearer service communication produce more returning customers.
RedAppy brings customer records, vehicle history, digital inspections, estimates, payments, scheduling, and repeat-business analytics into one shop workflow. Visit RedAppy to explore the features, then contact the team to see how the platform can help turn more first-time repair visits into planned return service.
Ready to Transform Your Shop?
RedAppy helps auto repair shops create professional digital estimates with photos and videos, send them instantly via text or email, and get customer approvals in seconds. No credit card required to start.