
Business Intelligence Reports for Auto Repair Shops
At closing time, the owner of an independent repair shop is still sorting through repair orders, checking the bank balance, and trying to decide whether a busy week was profitable. The bays looked full, technicians stayed active, and invoices went out, yet parts costs, missed labor, comebacks, and unsold capacity can hide the true result.
Business intelligence reports give shop owners a clearer operating view. They bring information from the shop management system, point-of-sale workflow, parts suppliers, labor guides, and customer records into reports that answer practical questions. Which services produce healthy margins? Which technicians convert billed hours into productive work? Which service advisors consistently present complete estimates? Where does a repair order lose profit before payment?
The purpose isn't to create a corporate control room. It's to help a shop manager make better decisions before a small leak becomes a permanent expense.
Table of Contents
- What Business Intelligence Reports Mean for Your Shop
- The KPIs That Drive Repair Shop Profits
- Essential Report Types Every Shop Should Track
- How to Read Reports and Turn Data Into Action
- Setting Up Your Reporting System and Cadence
- Common Reporting Mistakes and How to Avoid Them
- Taking the Next Step Toward Data-Driven Decisions
What Business Intelligence Reports Mean for Your Shop
A repair shop already produces a large amount of operational data. Every vehicle creates a trail of customer details, inspection findings, labor entries, parts purchases, estimate approvals, technician time, invoices, and payment records. The problem is that these details often sit in separate systems or remain trapped inside individual repair orders.
A shop owner may know total sales for a period but still lack a reliable view of effective labor rate, parts margin, bay utilization, or repeat business. A technician may appear busy because many jobs were opened, while the report shows that billed hours lagged behind available hours. A supplier may provide competitive part pricing on one category while eroding margin on another.

From scattered records to operating decisions
A useful report connects a number to a decision. Revenue by itself is descriptive. Revenue paired with repair order count, labor hours, parts cost, and service mix becomes diagnostic. The report can show whether growth came from profitable maintenance work, low-margin parts sales, large jobs that tied up bays, or estimates that included more approved recommendations.
This distinction matters because data fragmentation remains a major barrier to using insights effectively. Independent research identified fragmentation as the main barrier for 41% of respondents, while only 25% reported confidence in the accuracy and security of critical business data, as reported by. In a shop, fragmented data often means the parts invoice doesn't line up cleanly with the repair order, labor categories differ between advisors, or customer records create duplicate retention results.
Useful reporting stays focused
A dashboard shouldn't force a service advisor to scan every available metric. One dashboard guideline recommends 5 to 10 key metrics per view so users can read results quickly without overload, as explained in.
The strongest first reports usually answer four questions:
- Are profitable jobs being sold?
- Are technicians converting available time into billed work?
- Are parts and labor priced correctly?
- Are customers returning for recommended service?
Business intelligence has also become a substantial software category. One market summary valued the global business intelligence and analytics market at USD 29.18 billion in 2022 and projected USD 102.51 billion by 2030, with a projected compound annual growth rate of 17.1%. The same summary reported that subscription models represented 62% of business reporting software revenue in 2023, totaling USD 18.7 billion, as documented in this. For an independent shop, the practical meaning is simple: cloud reporting is no longer reserved for large corporate groups.
Practical rule: A report earns its place only when someone can name the action it should trigger.
The KPIs That Drive Repair Shop Profits
A shop can finish a busy day with strong car count and still miss its profit target. The cause may be discounted labor, low technician productivity, expensive parts, or recommended work that was never approved. The useful KPI is the one that points to a decision.
Track car count, invoice count, gross sales, labor sales, parts sales, hours sold, hours worked, technician efficiency, comeback rate, and retention. Review them as a connected operating picture rather than a long list. Average repair order shows whether advisors are presenting complete maintenance needs. Technician efficiency compares billed labor with available working time. Parts and labor gross margin exposes pricing or purchasing problems. Bay utilization shows whether the shop is converting capacity into revenue.
| KPI | What It Measures | Target Range | Why It Matters |
|---|---|---|---|
| Average repair order | Revenue generated per completed visit | Establish an internal baseline first | Shows service presentation, job mix, and approved work |
| Effective labor rate | Collected labor revenue divided by billed labor hours | Track against the shop's posted labor rate | Reveals discounting, underbilling, and low-value work |
| Technician efficiency | Billed hours compared with hours available | Compare by role and job type | Helps identify workflow, training, and dispatch issues |
| Technician productivity | Hours worked compared with hours available | Review alongside efficiency | Separates attendance and workload problems from skill or process issues |
| Parts gross margin | Parts revenue after part cost | Set by category and supplier | Protects profit from inconsistent pricing and purchasing |
| Bay utilization | Productive bay time compared with available capacity | Review by day and shift | Shows whether scheduling and facility capacity are working |
| Comeback rate | Repairs returning because the original concern wasn't resolved | Keep the trend moving downward | Protects margin, reputation, and technician time |
| Customer retention | Customers returning for later service | Compare by acquisition source and advisor | Measures whether the shop creates ongoing relationships |
| Parts-to-labor ratio | Relative contribution of parts and labor to each order | Compare by service line | Adds context to ARO and gross profit |
Target ranges require context. A tire-focused operation, diagnostic specialist, and general repair facility will show different job mixes and labor patterns. Use the shop's clean historical baseline first, then compare similar services, technicians, advisors, and periods. Copying another shop's benchmark can make a healthy operation look weak or hide a real problem.
Use primary KPIs with supporting measures
A higher ARO does not always mean better performance. Advisors may be discounting labor to close larger jobs, reducing the effective labor rate. Strong technician efficiency can appear alongside weak parts margin when urgent purchases come from expensive suppliers. High car count can also conceal poor retention if customers visit once and do not return.
Pair related measures before assigning a cause:
- ARO with approval rate: Shows whether larger estimates are being presented and accepted.
- Efficiency with productivity: Separates technician performance from scheduling or attendance issues.
- Parts margin with supplier and service line: Indicates whether the issue comes from purchasing, pricing, or job mix.
- Bay utilization with appointment flow: Helps identify whether empty capacity comes from demand, dispatch, or scheduling.
The point of pairing is practical. If efficiency is low and productivity is normal, review dispatching, job estimates, and workflow. If both are low, examine scheduling, attendance, or available demand. If ARO rises while approval rate falls, advisors may be writing larger estimates without converting them into approved work.
A KPI review should assign an owner, a next step, and a follow-up date. Without those three items, the report records an observation but does not change how the bays, technicians, or repair orders are managed.
Essential Report Types Every Shop Should Track
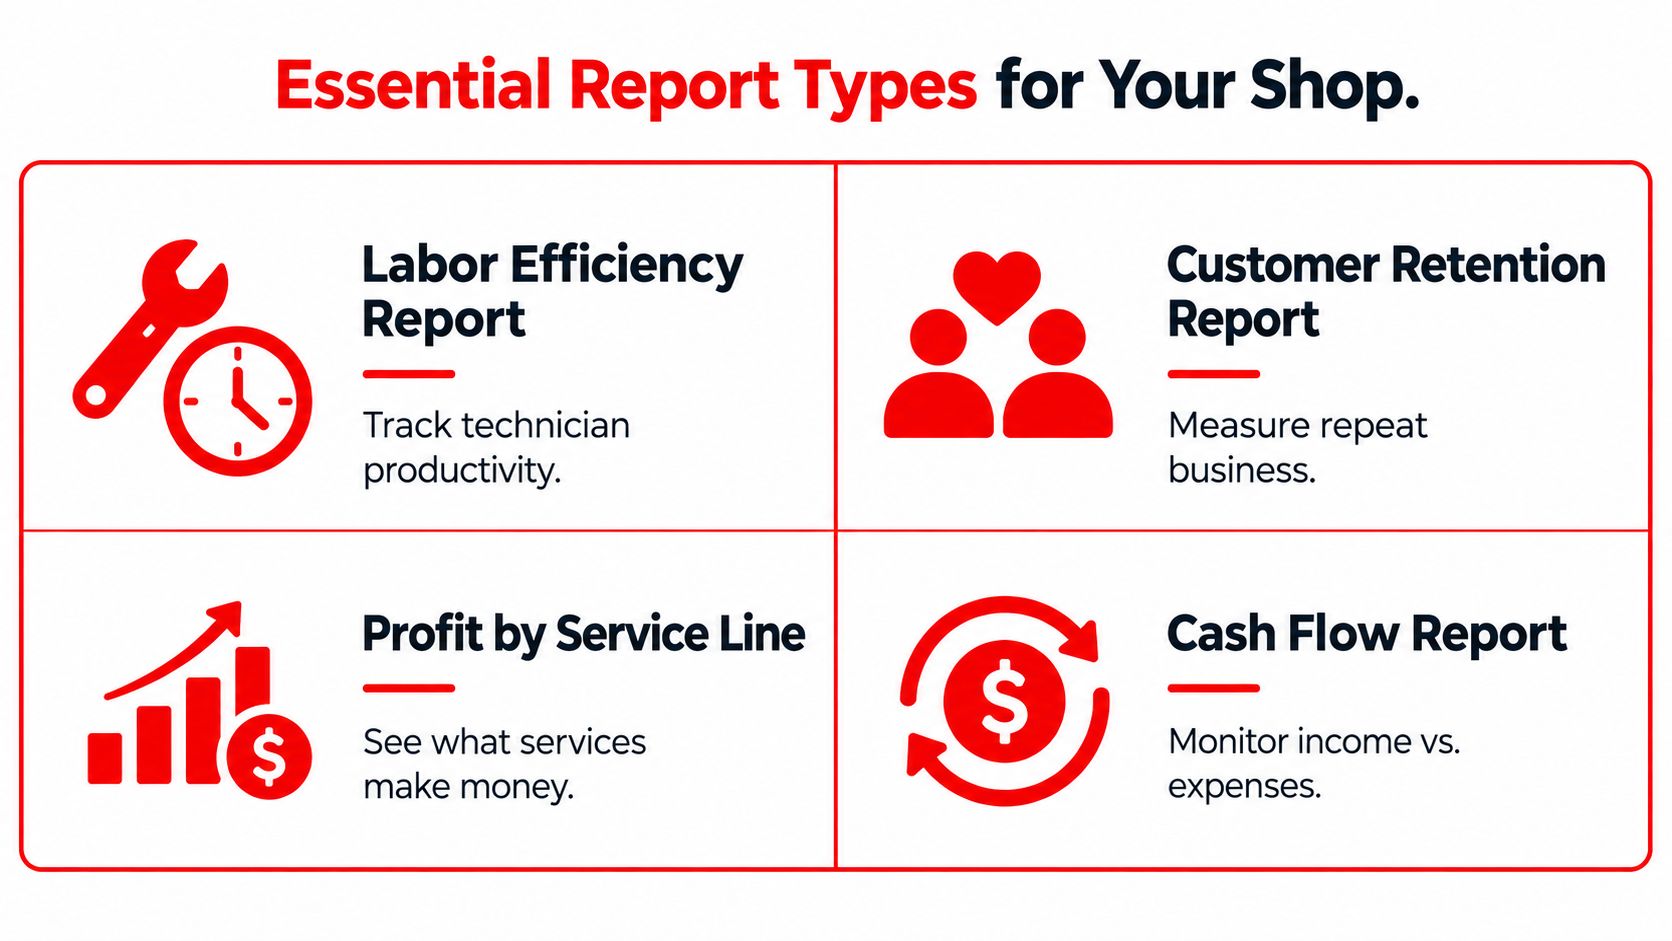
A shop doesn't need a report for every possible question. It needs a small reporting system that connects financial performance, workflow, and customer behavior.
Revenue and sales reports
Start with a revenue report that divides sales by labor, parts, service type, advisor, technician, and period. Total sales can confirm whether the shop collected money, but service mix explains where that money came from.
The report should help answer:
- Which repair categories generate healthy gross profit?
- Which advisors have a low approval rate on recommended work?
- Are discounts concentrated around one service type?
- Does a busy day produce enough billed labor to justify the staffing level?
Review the summary frequently enough to catch unusual movement, then investigate the repair orders behind it. A report that shows lower labor sales isn't useful until the manager can identify whether fewer cars arrived, fewer hours were sold, or more work was declined.
Technician performance reports
Technician reports should distinguish hours available, hours worked, hours billed, efficiency, productivity, and comeback history. A single productivity number can unfairly label a technician if the shop assigns that person difficult diagnostic work, training duties, or jobs with limited billable labor.
Use the report in coaching conversations, not as a public ranking. The right question is whether dispatch, parts availability, equipment, training, or repair procedure explains the result. The report should lead to a change in job assignment, support, inspection quality, or scheduling.
Parts margin analysis
Parts reports need supplier, category, quoted price, actual cost, billed price, return status, and repair order linkage. A shop can lose margin through outdated pricing, emergency purchases, unbilled materials, or inconsistent markup rules.
Compare parts margin with labor margin and service line. A brake job may appear strong because labor is profitable, while a supplier delay or special-order return makes the complete job less attractive. Managers should review exceptions instead of forcing every category into one markup rule.
Customer retention and bay utilization
Retention reports connect customer identity, vehicle history, completed service, declined work, recommended follow-up, and future visits. They help advisors contact customers whose maintenance recommendations remain open and show whether the shop is building repeat relationships.
Bay utilization reports add the capacity view. They should show open appointment slots, delayed jobs, parts-related idle time, technician availability, and completed work by bay or shift. Together, retention and utilization reports help answer two different questions: Will customers come back, and can the shop serve them efficiently when they do?
How to Read Reports and Turn Data Into Action
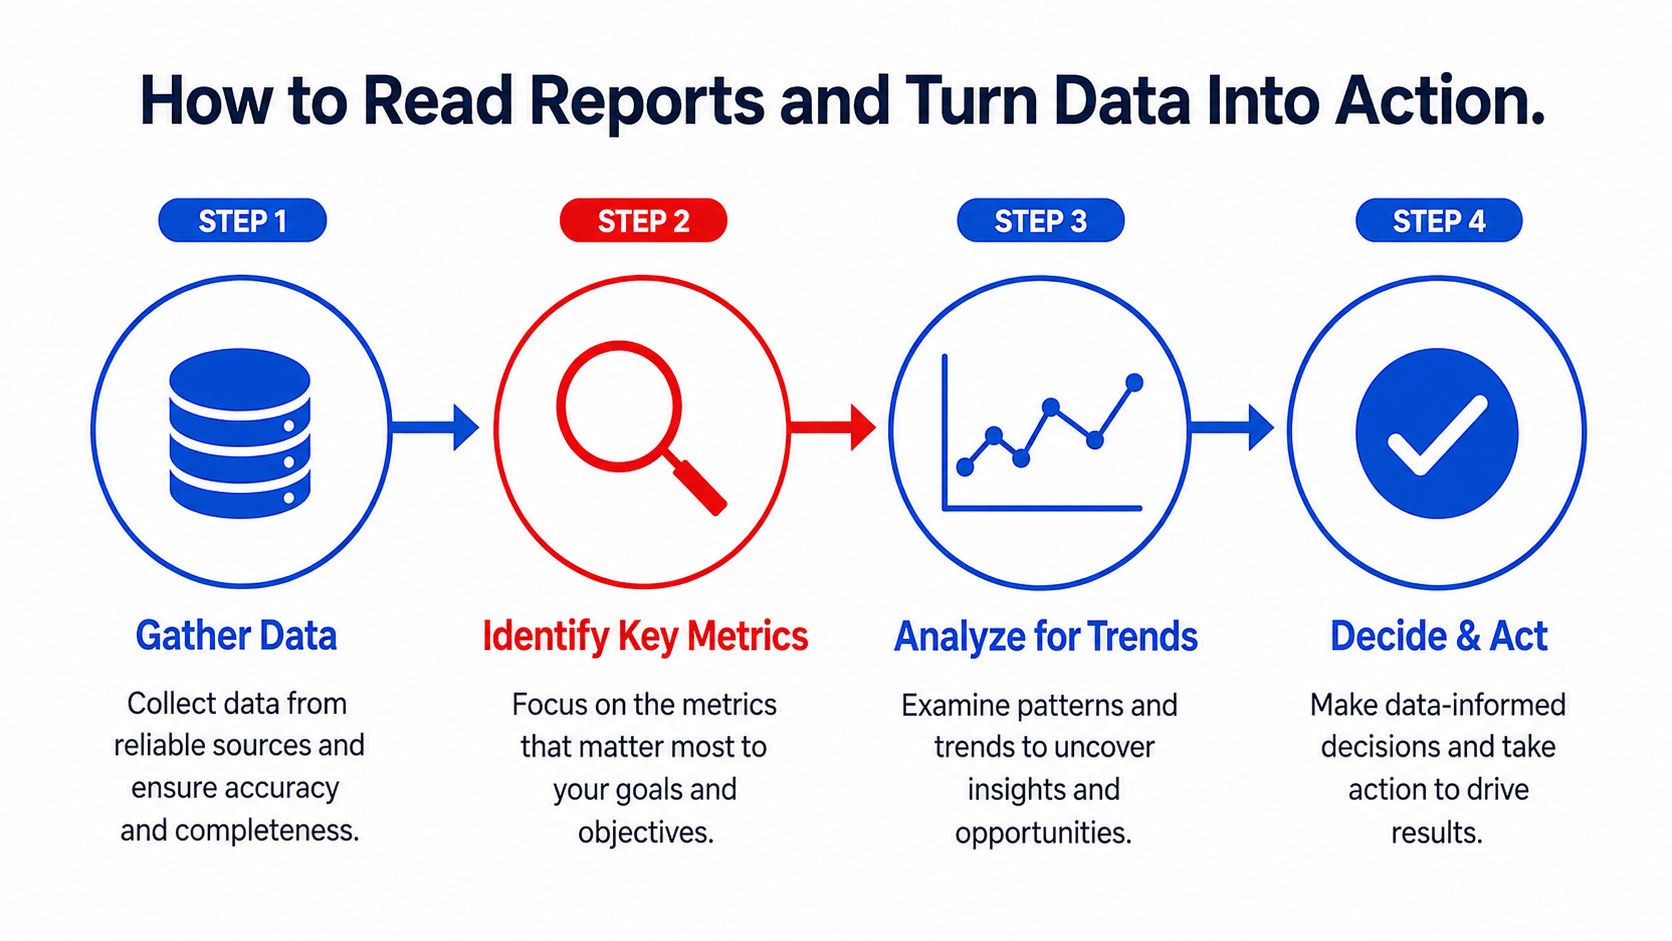
A report review should begin with a baseline, not a reaction. Managers need a consistent definition for each metric, a stable time window, and enough context to distinguish a real operating issue from an unusual repair mix.
Executive reporting guidance recommends giving every metric context through a target comparison, prior-period comparison, or trend direction, while keeping the primary KPI set focused and providing drill-down support, as outlined in. That approach works well in a repair shop because a number without comparison rarely tells an advisor what to do next.
A four-step reading method
- Identify the anomaly. Look for a meaningful change in ARO, labor rate, efficiency, margin, retention, or capacity.
- Isolate the variable. Filter by advisor, technician, supplier, service line, weekday, vehicle type, or job status.
- Test a hypothesis. Decide what might explain the movement, then check the underlying repair orders and workflow records.
- Measure the result. Assign one operational change and watch the same metric with the same definition.
Consider a shop that notices weaker bay utilization on Tuesdays. The report doesn't prove that demand is the problem. A drill-down may show that appointments are arriving, but parts delays leave vehicles waiting, or that the schedule places too many long diagnostics on one day. The manager can test a focused response, such as moving specific job types, confirming parts earlier, or promoting Tuesday appointments, then measure whether open capacity improves.
A dashboard should narrow the conversation from “What happened?” to “Who will change what before the next review?”
Freshness isn't the same as speed
A dashboard can render quickly and still show old information. Data freshness describes the age of the newest available record, while query latency describes how long the report takes to load. A fast screen displaying yesterday's repair orders isn't an operationally current report, as explained in.
Managers should define freshness expectations for revenue, open repair orders, technician time, parts status, and payment data. Pipeline operators can monitor freshness lag across source generation, ingestion, transformation, and publishing, using p50, p95, and p99 lag alongside on-time refresh rate, according to.
Setting Up Your Reporting System and Cadence
The most reliable reporting system starts with the shop's existing workflow. A tool should connect with the shop management platform, POS process, parts ordering systems, and labor guide data without forcing staff to re-enter every transaction.
Data hygiene comes before dashboard design. Standardize labor codes, service categories, advisor names, technician identifiers, supplier names, comeback labels, and customer records. If one advisor records “brake service” while another uses “brakes,” the report may split one service line into two and make the result look more complicated than it is.
Build the first version around a small operating loop
Begin with revenue, ARO, and technician efficiency. Confirm that each number ties back to actual repair orders, then add parts margin, retention, bay utilization, and comeback reporting after the team trusts the first set.
Managers should also connect reporting to financial planning. Shops that want a more disciplined way to align expected income and expenses can review this resource on, then use the same category discipline when building operating reports.
| Report Type | Frequency | Owner | Key Decision Triggered |
|---|---|---|---|
| Revenue and car count flash report | Daily | Manager or service advisor | Investigate an unusual sales, workload, or payment movement |
| Technician efficiency review | Weekly | Shop foreman | Adjust dispatch, training, equipment, or workload |
| Parts margin report | Weekly or monthly | Parts or operations lead | Review supplier pricing, markup, returns, or unbilled items |
| ARO and approval report | Monthly | Service manager | Coach estimate presentation and follow-up |
| Customer retention report | Monthly | Customer service owner | Contact overdue customers and improve follow-up |
| Bay utilization report | Monthly | Shop manager | Change scheduling, staffing, or appointment mix |
| Strategic performance review | Quarterly | Owner and leadership team | Set priorities for capacity, investment, and staffing |
Keep the meeting short and accountable
A weekly KPI meeting can fit into a practical sequence:
- Review the agreed metrics: Confirm the numbers and note unusual movement.
- Select one exception: Avoid turning the meeting into a general complaint session.
- Name the cause to investigate: Assign the advisor, foreman, or manager who owns the follow-up.
- Choose one action: Change scheduling, pricing, workflow, training, or customer follow-up.
- Set the next check: Review whether the action changed the selected metric.
A gradual rollout works better than a complicated launch. During the first phase, the owner validates definitions and data quality. During the next phase, the team adds operational detail. Once the reports become part of normal meetings, managers can expand the system without overwhelming the front desk.
Common Reporting Mistakes and How to Avoid Them
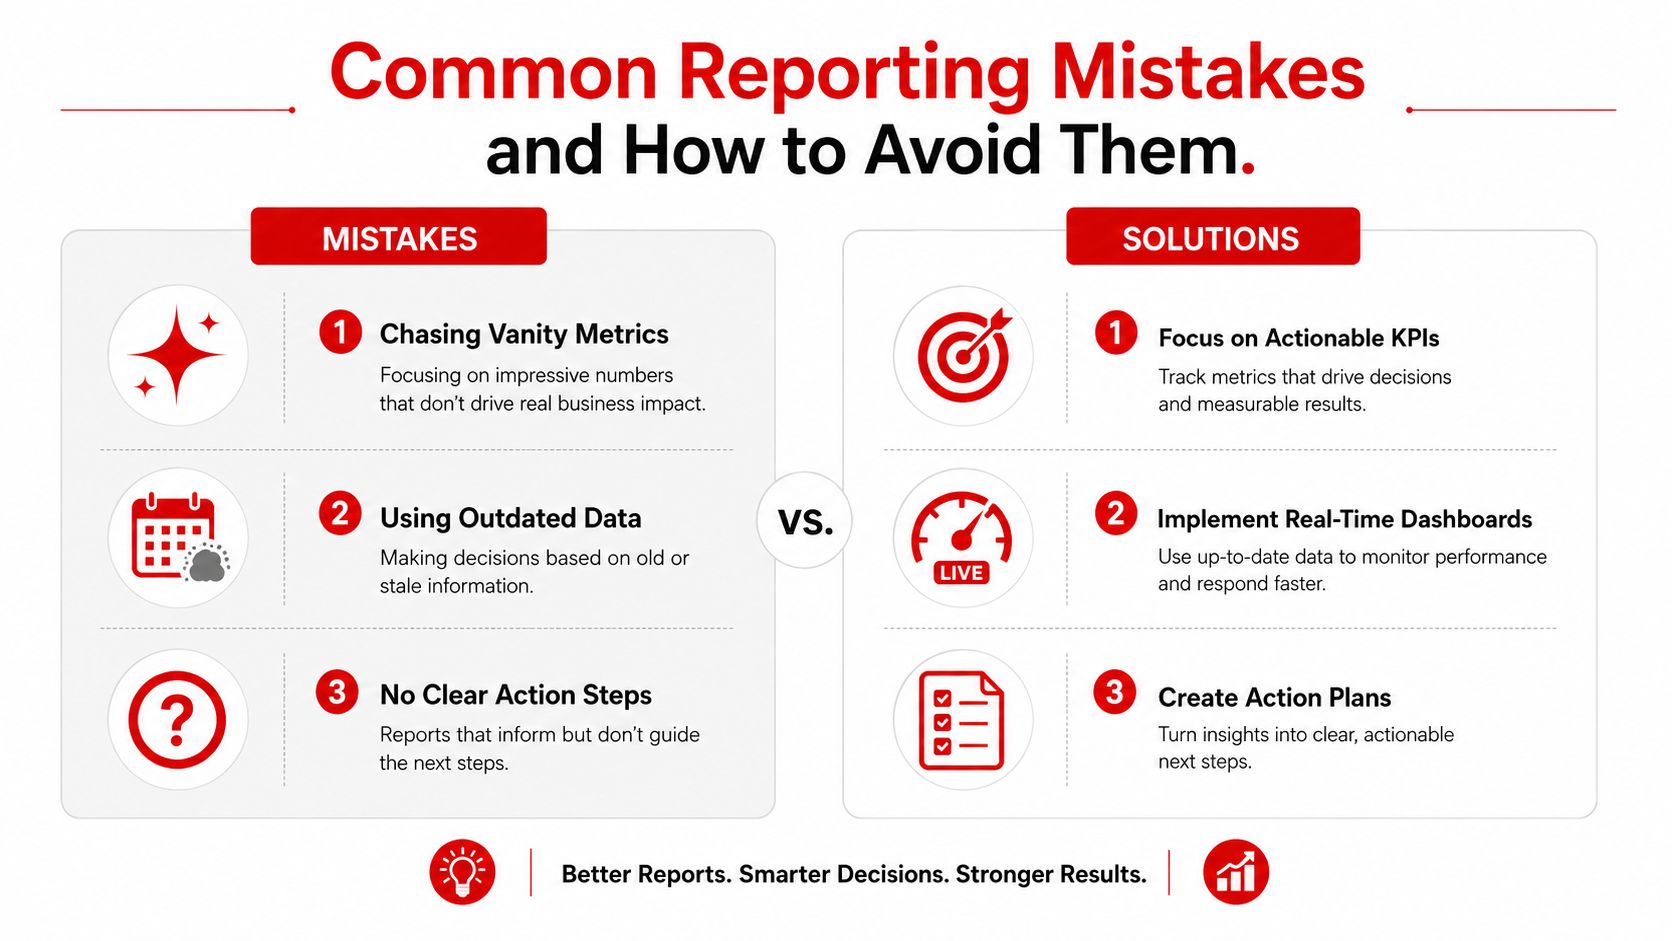
The most expensive reporting mistake is treating activity as performance. A high repair order count can look healthy while low ARO, weak retention, poor parts margin, or excessive comebacks consume the profit.
A shop can also make a bad decision by cutting marketing after seeing stronger car counts. If the new customers rarely return or arrive through low-margin work, the car count doesn't justify the conclusion. The correction is to connect acquisition source, ARO, gross profit, and retention before changing spend.
The habits that weaken reports
- Tracking everything: Start with a small KPI set tied to decisions. Add a metric only when someone can explain how the shop will use it.
- Comparing against other shops: Use outside benchmarks carefully. The shop's own history, service mix, and operating model provide a more useful reference point.
- Ignoring stale data: Check refresh status and record age before reacting to a dashboard. A delayed supplier feed can make a margin problem appear worse or better than it is.
- Skipping data cleanup: Standardize repair order categories, technician time entries, customer records, and comeback codes before trusting trends.
- Reviewing without ownership: Every exception needs a named person, an action, and a follow-up date.
- Punishing people with incomplete context: Use technician reports to investigate workflow and support needs, not to create simplistic rankings.
A governance-focused program can track pass rates for priority quality rules, freshness compliance, unresolved severe issues beyond agreed thresholds, duplicate rates for key reference entities, and trends in completeness, validity, or consistency, as described in this.
Audit question: Can the manager trace every important dashboard number back to a repair order, a source transaction, and a clearly defined calculation?
Taking the Next Step Toward Data-Driven Decisions
Business intelligence reports only create value when they change shop behavior. Revenue, ARO, technician efficiency, parts margin, retention, and bay utilization matter because they help owners decide where to schedule work, how to coach advisors, which suppliers to review, and where margin disappears.
Adoption remains a practical challenge. BARC research found that employees actively using BI and analytics tools averaged 25%, with minimal growth over seven years of tracking. At the same time, 92% of respondents said usage had increased over the prior five years, including 50% who said it had increased a lot. The same research identified self-service authoring tools at 73%, data preparation tools at 48%, and embedded BI and analytics at 38% as technical drivers, according to the.
That gap explains why a dashboard alone won't fix reporting. Staff need clear definitions, simple views, trustworthy data, and a meeting where the numbers lead to decisions. Recent research also found 71% of companies said their BI tools weren't keeping up, 76% reported slow performance, and 87% said data volumes had increased in the previous year, as reported in.
A practical starting sequence is straightforward:
- Audit the shop's data sources and identify missing or inconsistent fields.
- Select a reporting tool that fits the shop's size, workflow, and existing systems.
- Schedule the first weekly KPI review and assign ownership for every follow-up.
The first reporting meetings may feel like extra work. That effort becomes useful when the team catches unbilled labor, supplier margin erosion, idle capacity, weak estimate follow-up, or customers who need a service reminder before those issues become normal operating conditions.
RedAppy brings shop workflow and reporting into one platform, with analytics for revenue, technician efficiency, average repair order, and repeat business alongside digital inspections, estimates, parts ordering, scheduling, and invoicing. Visit RedAppy to review the reporting features and see whether the system fits the way the shop operates.
Ready to Transform Your Shop?
RedAppy helps auto repair shops create professional digital estimates with photos and videos, send them instantly via text or email, and get customer approvals in seconds. No credit card required to start.