Reports
Read your shop numbers in Analytics
RedAppy Analytics turns invoices, estimates, payroll, and purchases into reports: revenue over time, repeat customers, technician leaderboard, profit by tech.
Everything you record in RedAppy feeds Analytics, with no setup and nothing to export. Pick a report on the left, pick a date range at the top, and every report explains its own math in a How are these numbers calculated? section at the bottom.
Open a report
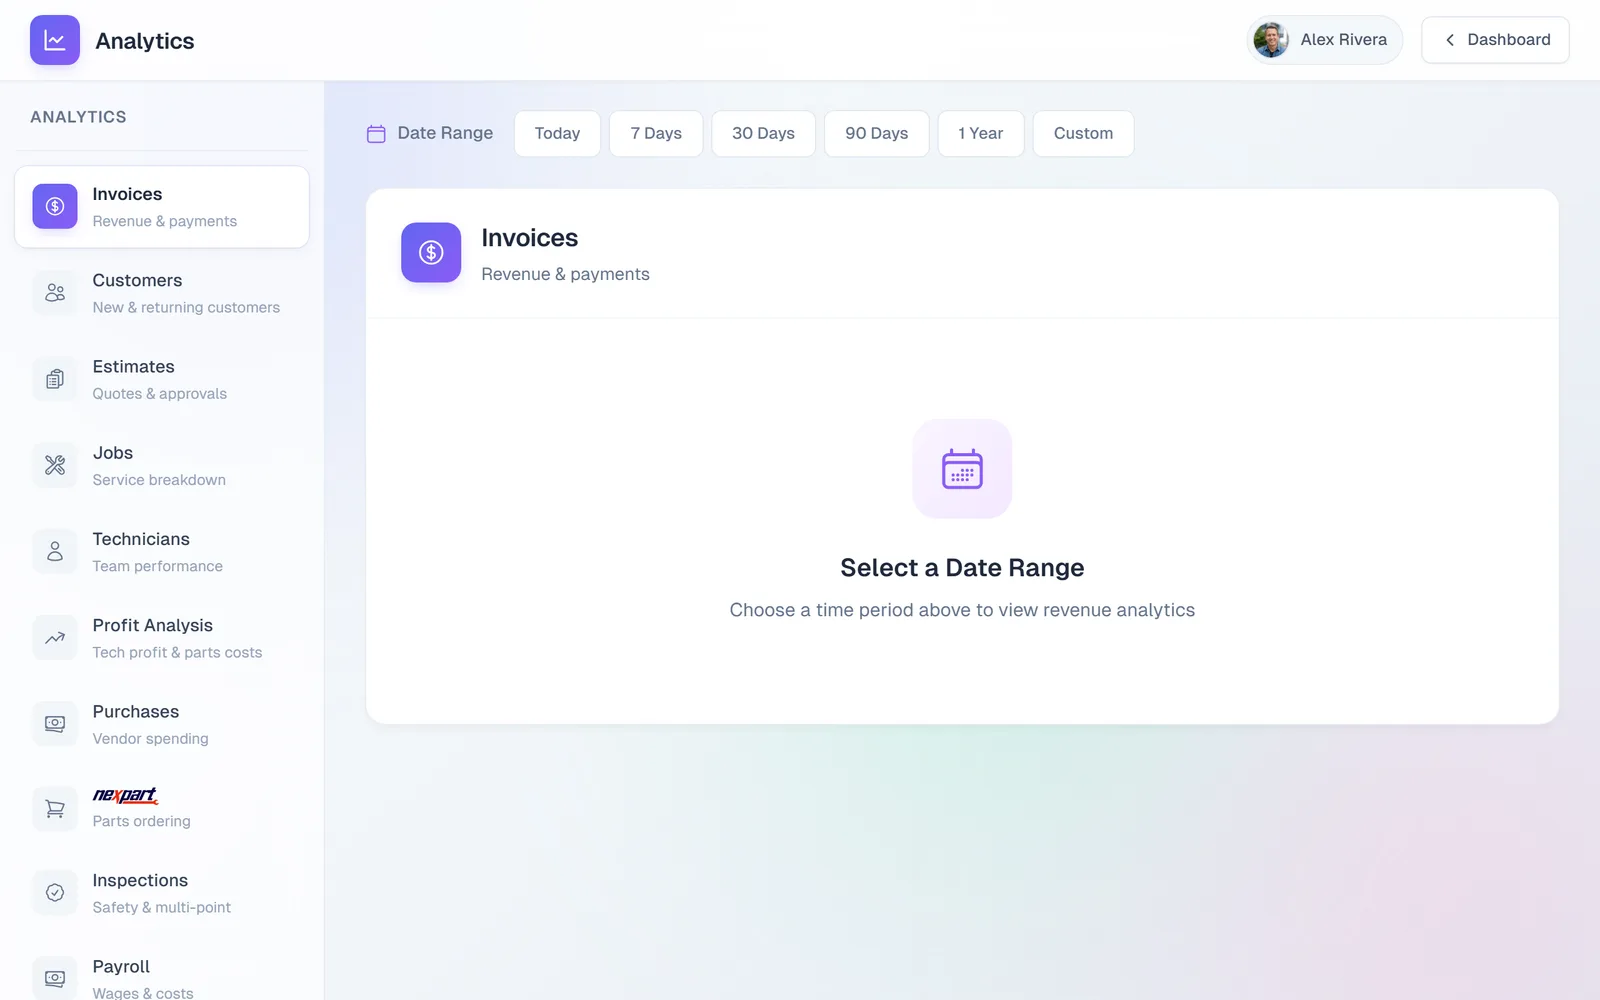
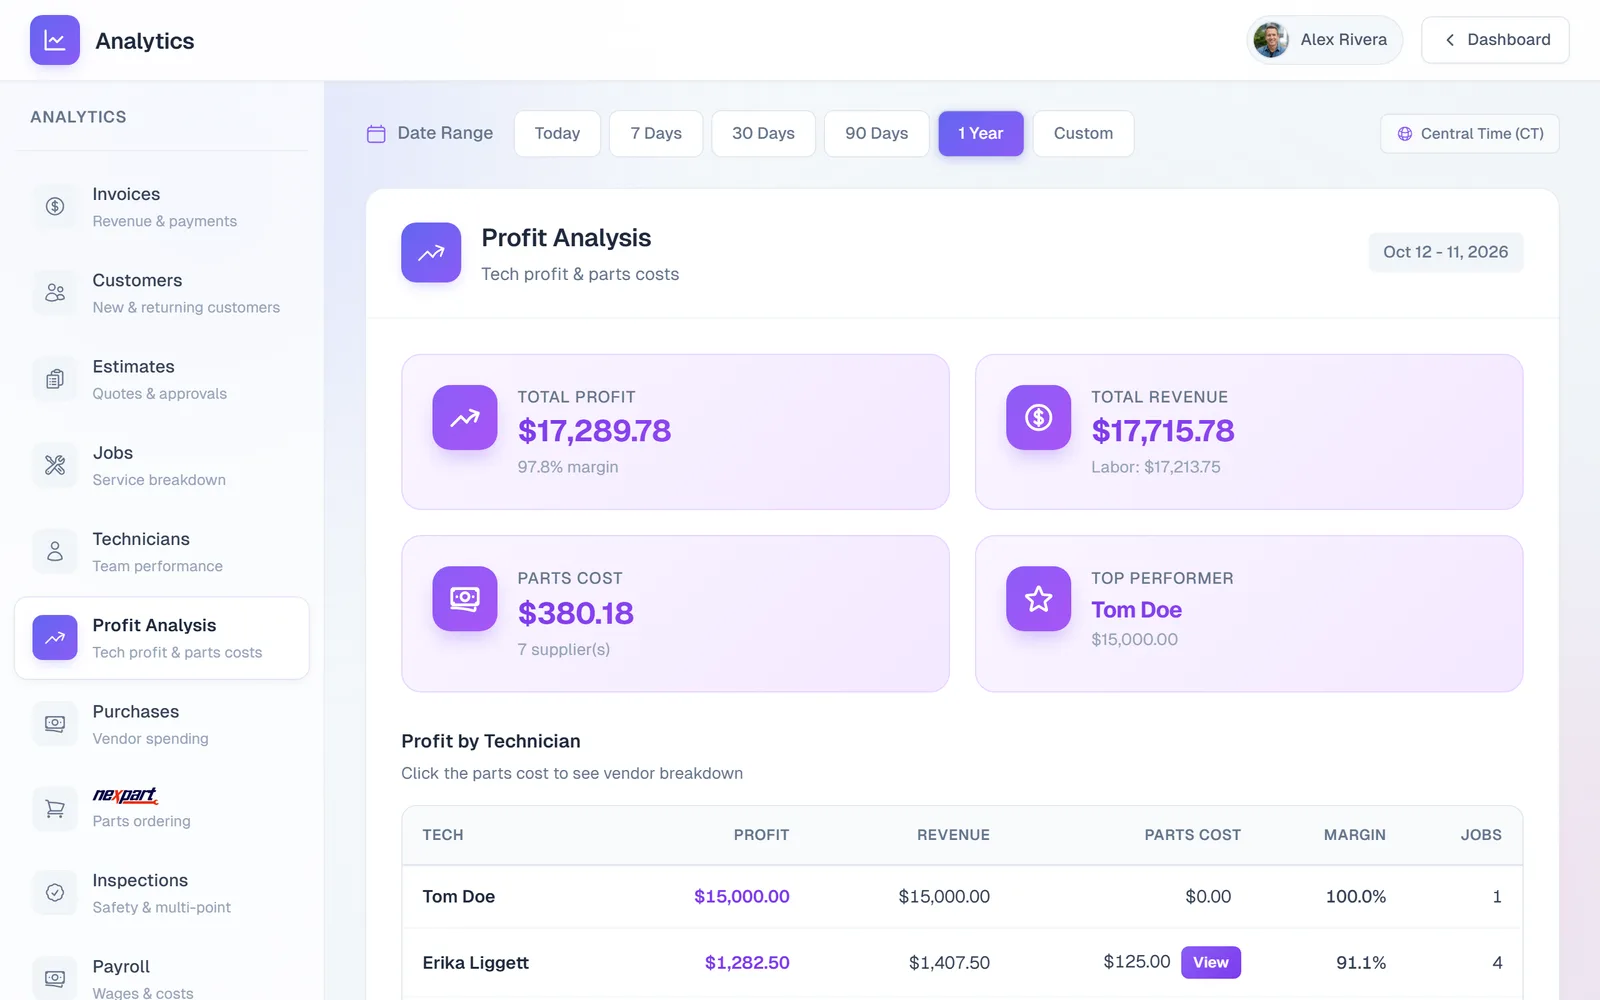
Open Analytics from the dashboard. The left menu lists the reports: Invoices, Customers, Estimates, Jobs, Technicians, Profit Analysis, Purchases, Nexpart Parts Ordering, Inspections, Payroll, and Misc Income. Pick one, then choose Today, 7 Days, 30 Days, 90 Days, 1 Year, or Custom dates. Times use your shop's timezone.
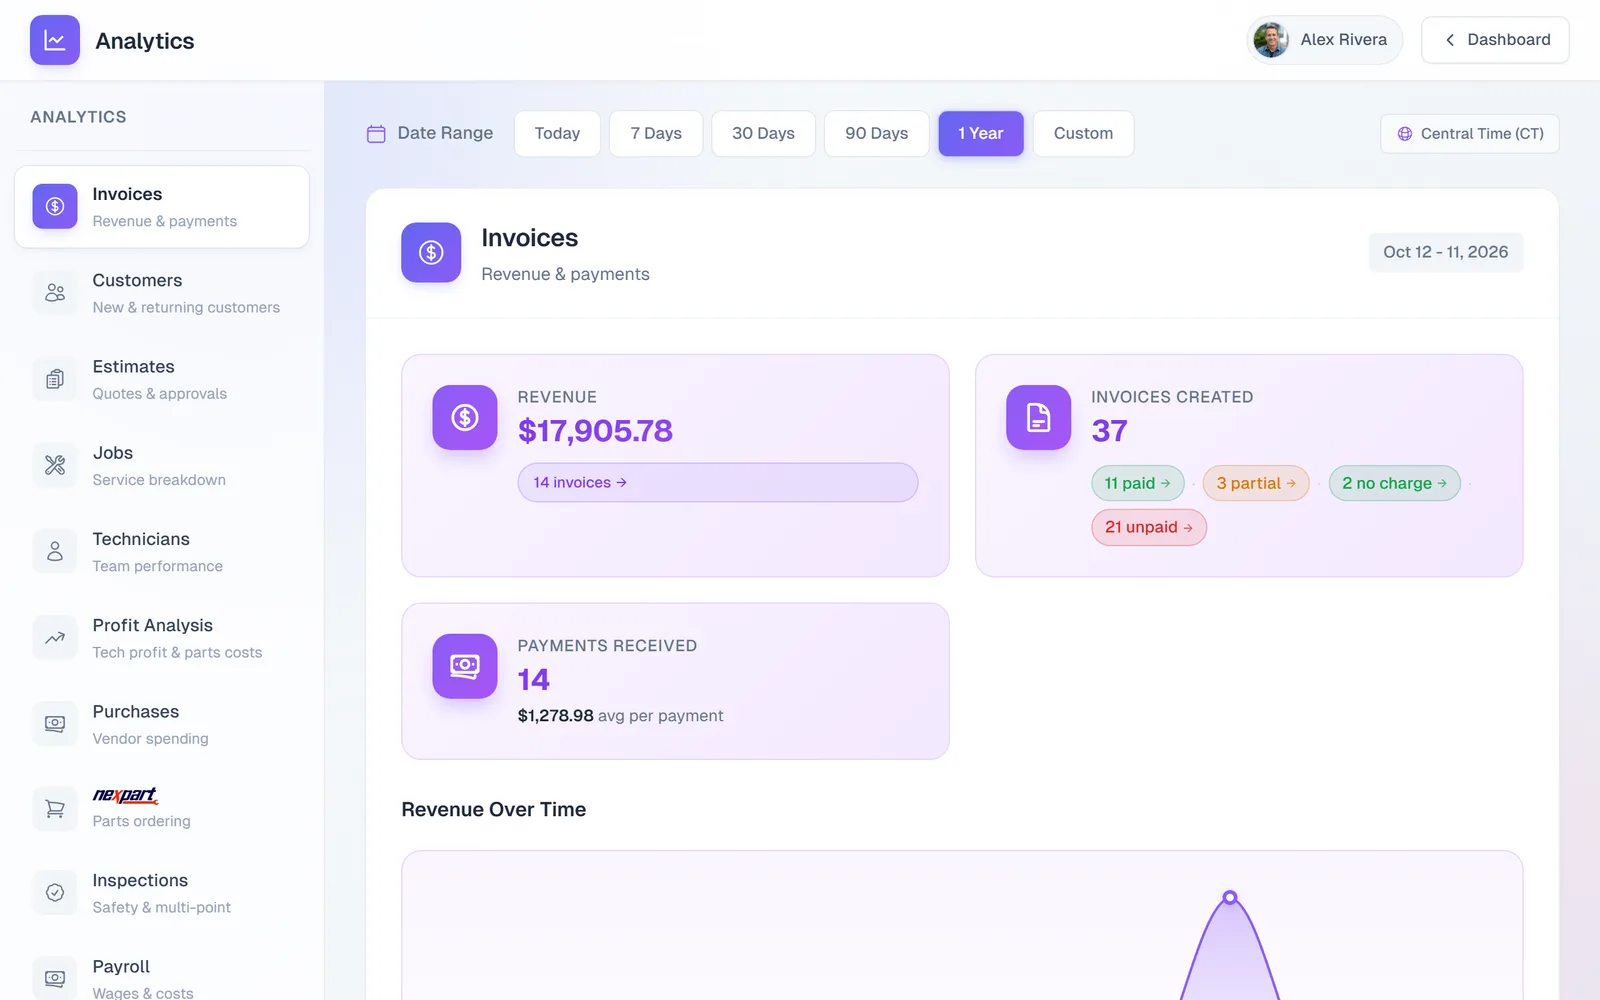
Invoices is money in: Revenue (payments received in the period), Invoices Created split into paid, partial, no charge, and unpaid, Payments Received with the average payment, a Revenue Over Time chart, and a Payment Breakdown by cash, card, Zelle, and so on.
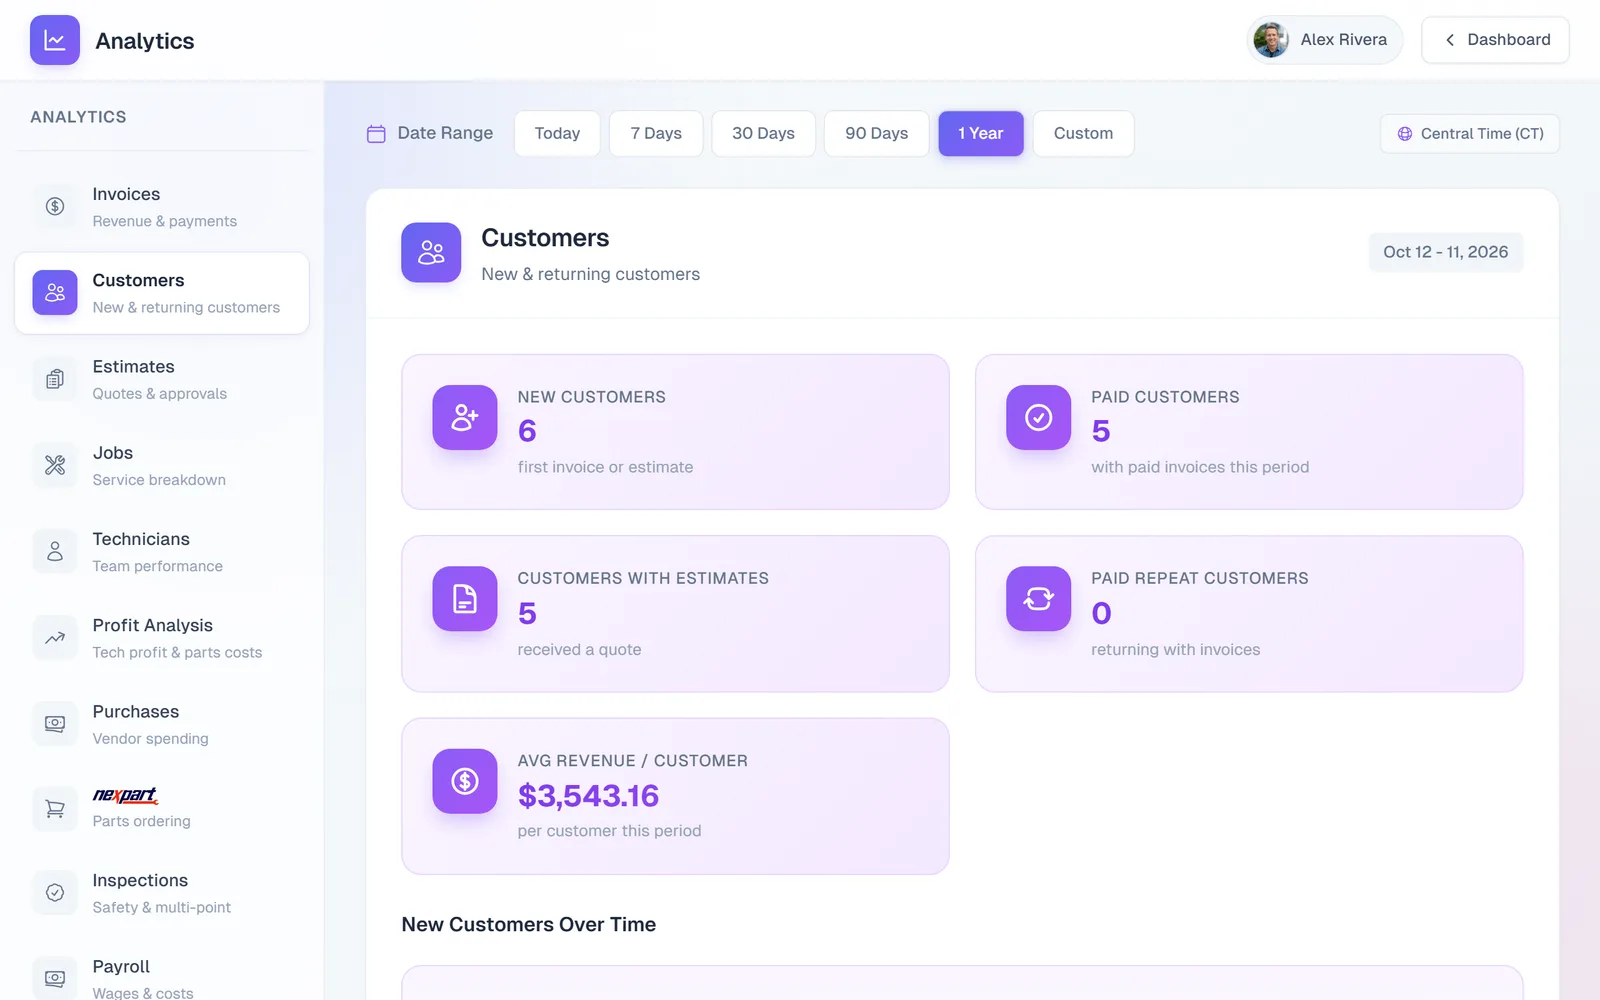
Customers shows new customers, how many paid, how many got an estimate, repeat customers, and average revenue per customer, with a Top Customers table by spend and visits.
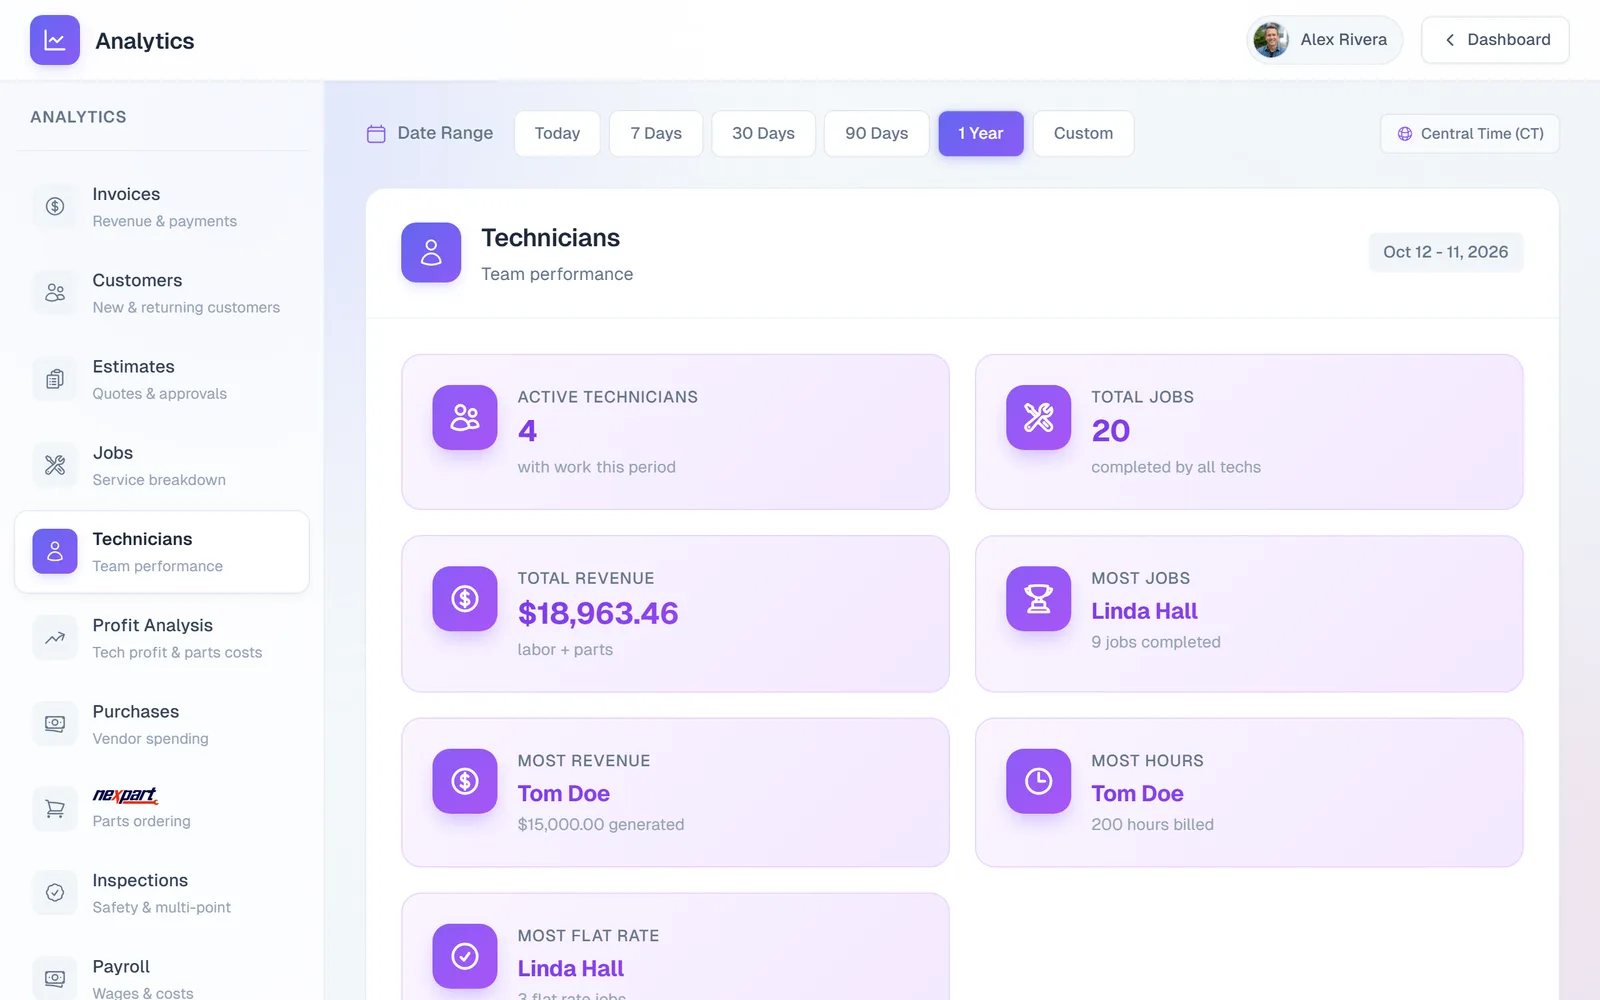
Technicians is the leaderboard: jobs completed, hours billed, flat-rate jobs, and revenue per tech, with a View Tech Report for each person. Sort by jobs, revenue, hours, or flat-rate jobs.
Profit Analysis subtracts parts cost from revenue per technician to show profit and margin, lists shop charges that are not credited to techs (supplies, environmental and storage fees, tax, discounts), and lets you click a parts cost to see which vendors it went to.
The other reports
- Estimates: quotes sent, approved, and expired, so you can see your close rate.
- Jobs: which services you do most and what they bring in.
- Purchases and Nexpart Parts Ordering: what you spent with each vendor.
- Inspections: state and multi-point inspection counts and income.
- Payroll and Misc Income: wages paid and income outside of invoices.
Frequently asked questions
Revenue counts payments received in the period, including payments on invoices created earlier. Invoice totals count what was billed. The explanation at the bottom of each report spells this out.
Reports are on screen today. Use the browser print function for a PDF, or open the underlying list (Invoices, Payroll, and so on) in the admin and use its Columns and Filters.
Whoever you have given Can Access Analytics to on their user record. See Add your team.